Every feature

Every Aqueduct feature, one problem at a time.

Each feature is written the same way: the problem, then the flywheel that resolves it, then what powers it. Outcomes lead, and modules appear only as powered by.
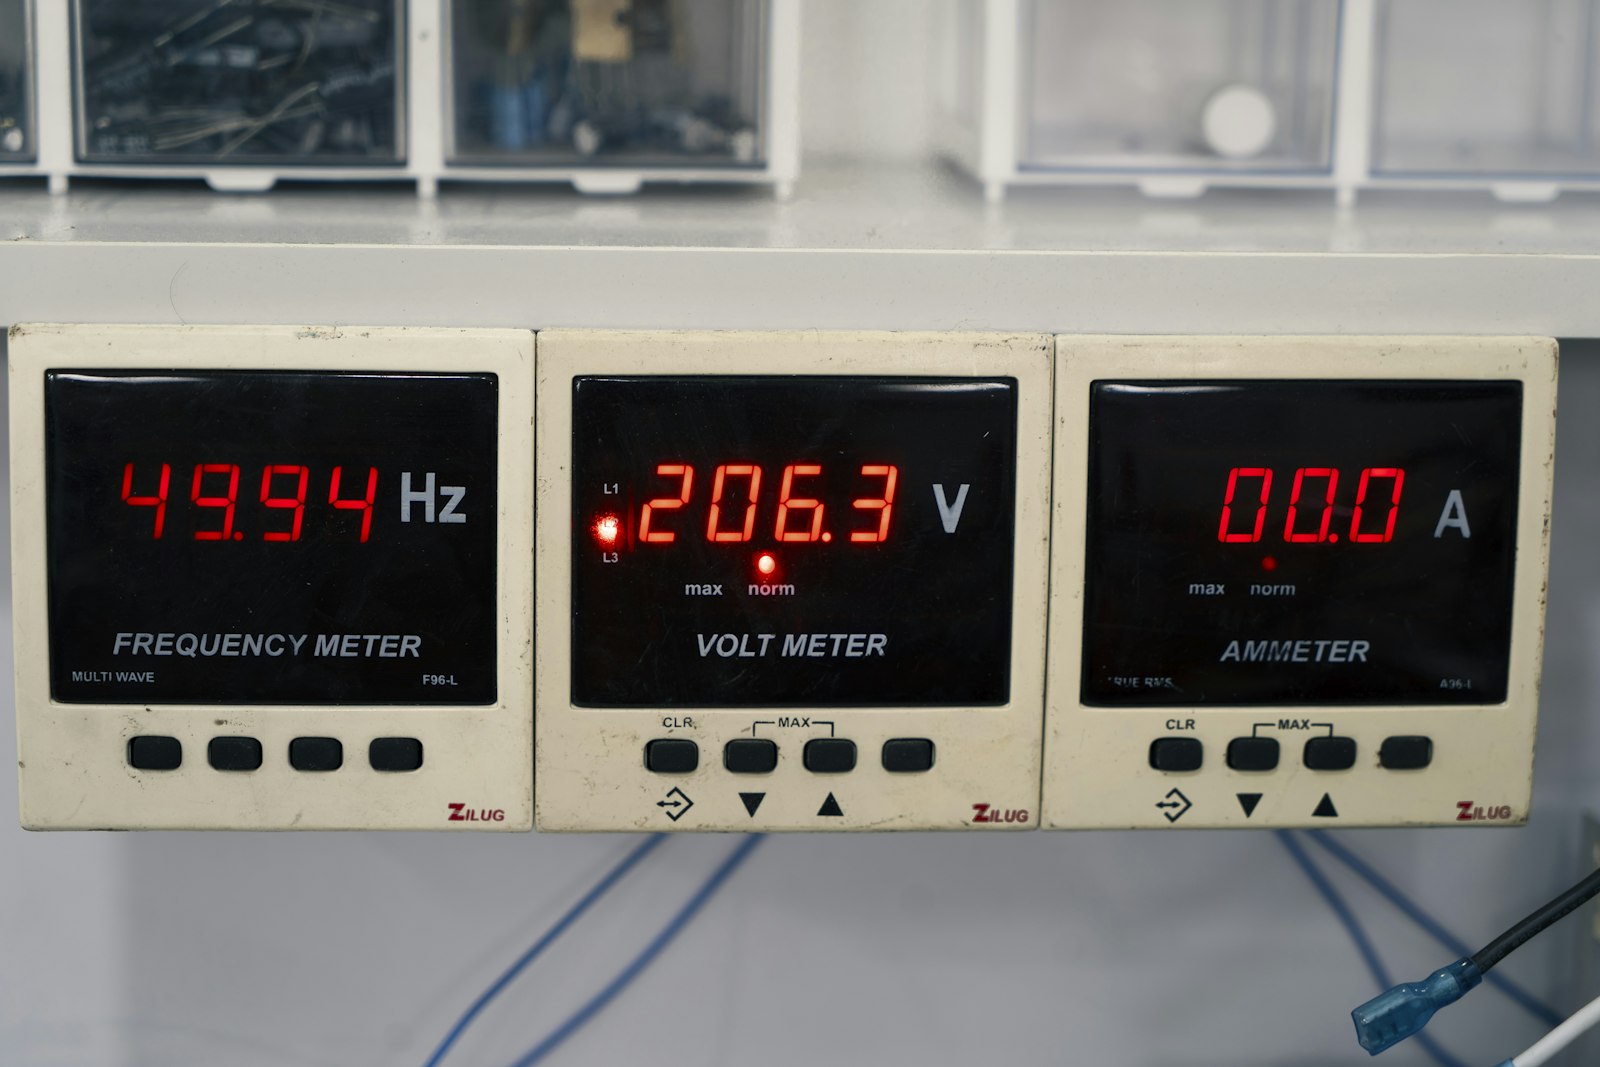
Panel meters showing frequency, voltage and current
Water balance · live
42.6Supply=36.1Floors+4.2RO+2.3Loss
Unaccounted loss rising on line CW-4
Demo data
AHU-1 · fault
Supply fan stopped08:02
Failed rotor shaft08:03
Routed to CMMS08:04
Airflow confirmed11:40
Demo data

Water intelligence

Powered by WaterGuard · 10 features
Leak detectionLeaks found from the balance, not the bill. Localized to the node, priced per month, ticket routed.Water balanceInflow equals use plus loss, per site, block and node, closing every hour.Non-revenue waterMetered supply against billed and metered use. Loss with an address.Burst detectionNight-flow and rate-of-change analysis flags a burst in minutes, then isolates on approval.
Sub-meteringSub-meters reconcile to the main meter. Tenants and processes billed on measured use.Page coming soon
Water quality monitoringQuality parameters alongside quantity, with thresholds per use.Page coming soon
Reuse and recharge trackingTreated reuse and rainwater recharge metered into the balance, so water-positive claims hold.Page coming soon
Cooling tower make-upMake-up, blowdown and cycles of concentration tracked per tower.Page coming soon
Water bill validationSupplier bills checked against metered use, line by line.Page coming soon
Network loss reductionDistrict metered areas and mains, read alongside SCADA and AMI. Control stays where it is.Page coming soon

Energy efficiency

Powered by EnergySmart · 10 features
Weather-normalized baseliningRegression on usage plus cooling and heating degree days. The expectation before the claim.Measurement and verification (M&V)The Verify step as a named capability. Savings confirmed at the meter, evidence retained.Peak demand managementSee the peak coming. Pre-cool, stagger, shed, with every command logged.Load disaggregationWhole-site load split by asset and circuit, so waste has a name.
Power qualityPower factor, harmonics and imbalance, tied to the equipment causing them.Page coming soon
Energy bill validationSupplier bills against sub-meters every month. Disputes carry the data.Page coming soon
Tenant sub-billingTenants billed on metered use, exports to your billing system.Page coming soon
Tariff analyticsRate configuration turns every kWh delta into money, per tariff and time band.Page coming soon
Setpoint optimizationSetpoints and schedules adjusted where control is enabled, with owner approval.Page coming soon
Portfolio benchmarkingSites ranked by intensity and cost, normalized so the comparison is fair.Page coming soon

Healthy air

Powered by AirSafe · 8 features
Indoor air quality monitoringCO2, PM2.5, VOC, temperature and humidity per zone, continuously.CO2 monitoringZone targets with ventilation response. Occupied hours only, if you choose.PM2.5 and PM10 monitoringThe real curve during operations, not a weekend reading.VOC monitoringNightly patterns, cleaning cycles and off-gassing seen and traced.
Demand-controlled ventilationFresh air follows occupancy and CO2. The energy cost is counted.Page coming soon
Ventilation boost and controlBoost on threshold, relax when in range, verified back in range.Page coming soon
Thermal comfortTemperature and humidity against comfort bands per space type.Page coming soon
Certification evidenceContinuous zone-level records for WELL, RESET and ASHRAE. We supply the metrics; you file.Page coming soon

Facility operations

Powered by aQ PredictIQ on aQ Core · 15 features
Fault detection and diagnostics (FDD)Faults found, diagnosed and fixed. Root cause in plain language, ticket routed with the fix.Predictive maintenanceVibration, sound and energy drift caught before the fault, so the disruption never happens.Asset observabilityEvery asset, its state and health: running, drifting, stopped, silent.Digital twinSites, floors, zones, devices and equipment in one live model. aQ Atria context and 3D views.
CMMS integrationTickets in, verified closure back. Your CMMS manages the work.Page coming soon
BMS and BAS integrationRead points, act through sequences and schedules. Keep it, replace it, or build it in.Page coming soon
SCADA integrationRead network data alongside SCADA. Control stays with SCADA.Page coming soon
AMI and historian integrationMeter reads and time series from the systems utilities already run.Page coming soon
Alerts and routingPrioritized, priced and routed to the seat that owns it. Not buried in email.Page coming soon
Auditable command historyEvery action: who, what, when, why, and whether it executed.Page coming soon
aQ AssistantAsk the building a question. Which site, zone or asset changed, with the evidence attached.Page coming soon
On-prem AIDeploy on NVIDIA infrastructure on site, for data that cannot leave.Page coming soon
ESG and certification metricsThe verified numbers behind your reports and certifications. We supply them; you file.Page coming soon
Carbon accounting inputsMeasured energy and water inputs for Scope 1 and 2 calculations.Page coming soon
Portfolio analyticsRank and benchmark the estate by usage, intensity and cost.Page coming soon

Every feature solves one problem, then proves the result at the meter.

Water intelligence

Leaks, losses and treatment, from inlet to last tap

  • Leak detection

    Unaccounted loss from the live balance, located to the node and priced per month.

  • Water balance

    Supply equals use plus loss, shown as an equation that refreshes every 60 seconds.

  • Burst and network loss

    Rate of change and night flow catch bursts, and district balances locate network loss.

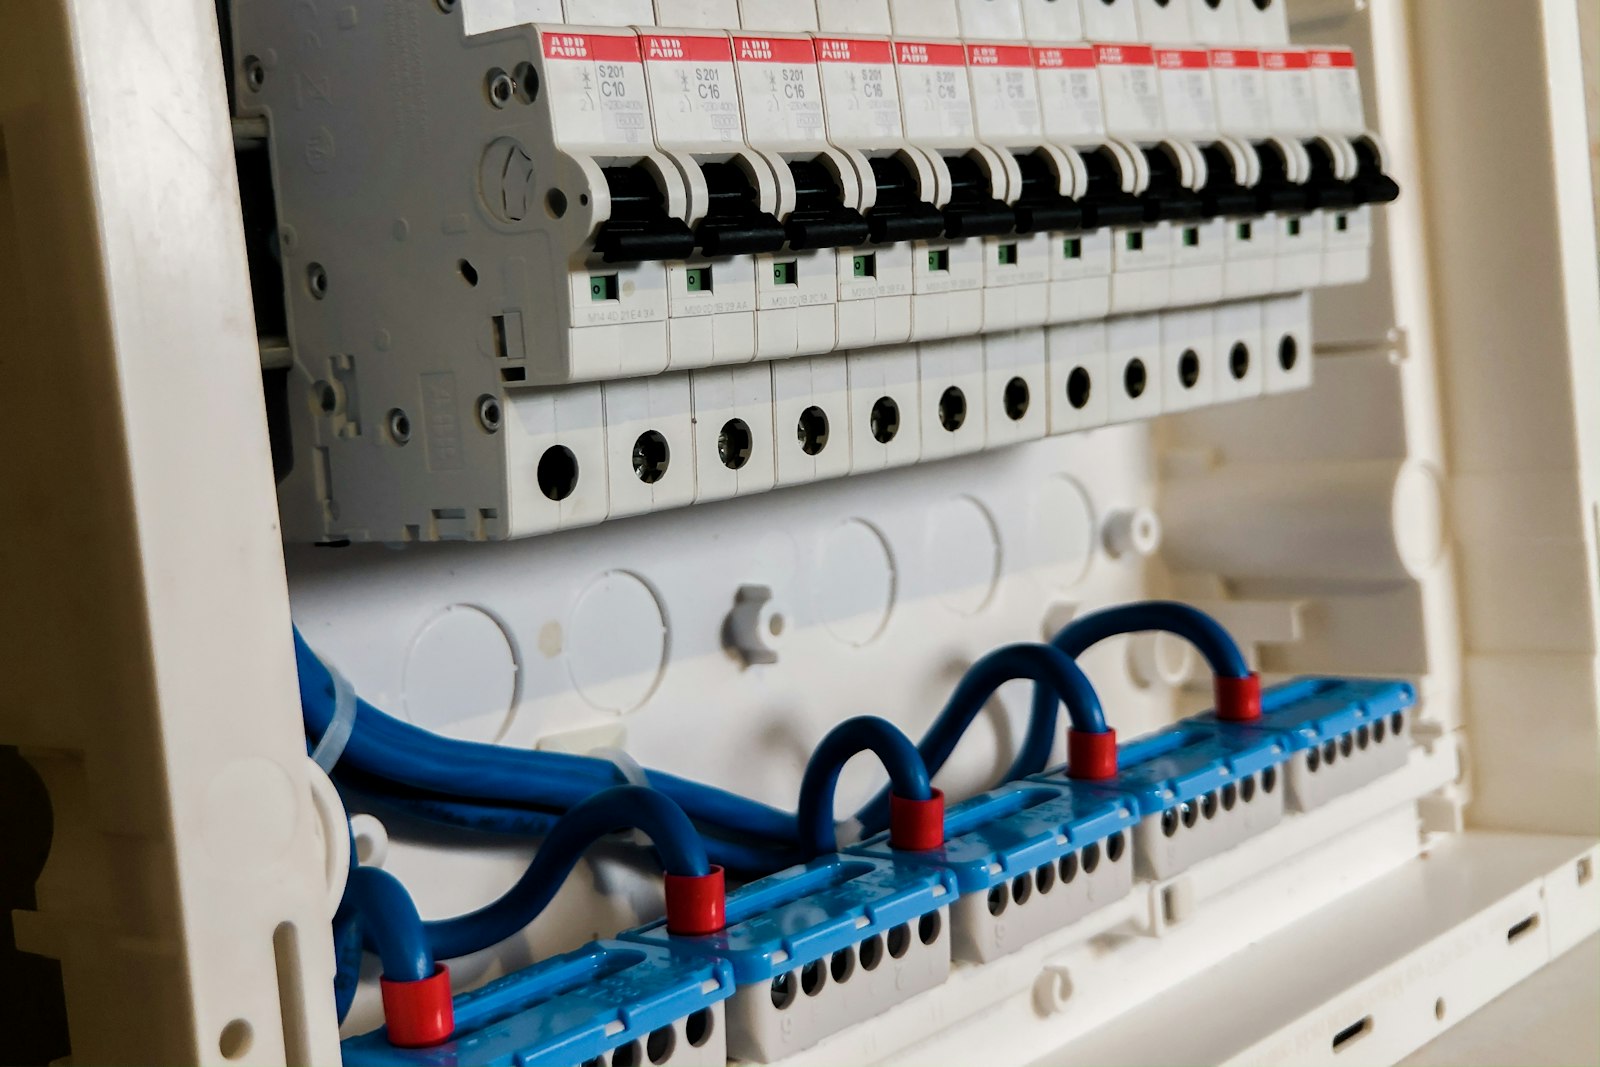
White pipework and junction boxes
Water balance · live
42.6Supply=36.1Floors+4.2RO+2.3Loss
Unaccounted loss rising on line CW-4
Demo data
Energy efficiency

Waste named, demand managed, savings verified

  • Weather normalized baselining

    Regression on usage plus cooling and heating degree days sets the expectation before any claim.

  • Peak demand

    Loads staggered and spaces pre-cooled where control is enabled, with command history kept.

  • Load disaggregation

    The live single line splits the whole-site number by source, feeder and equipment.
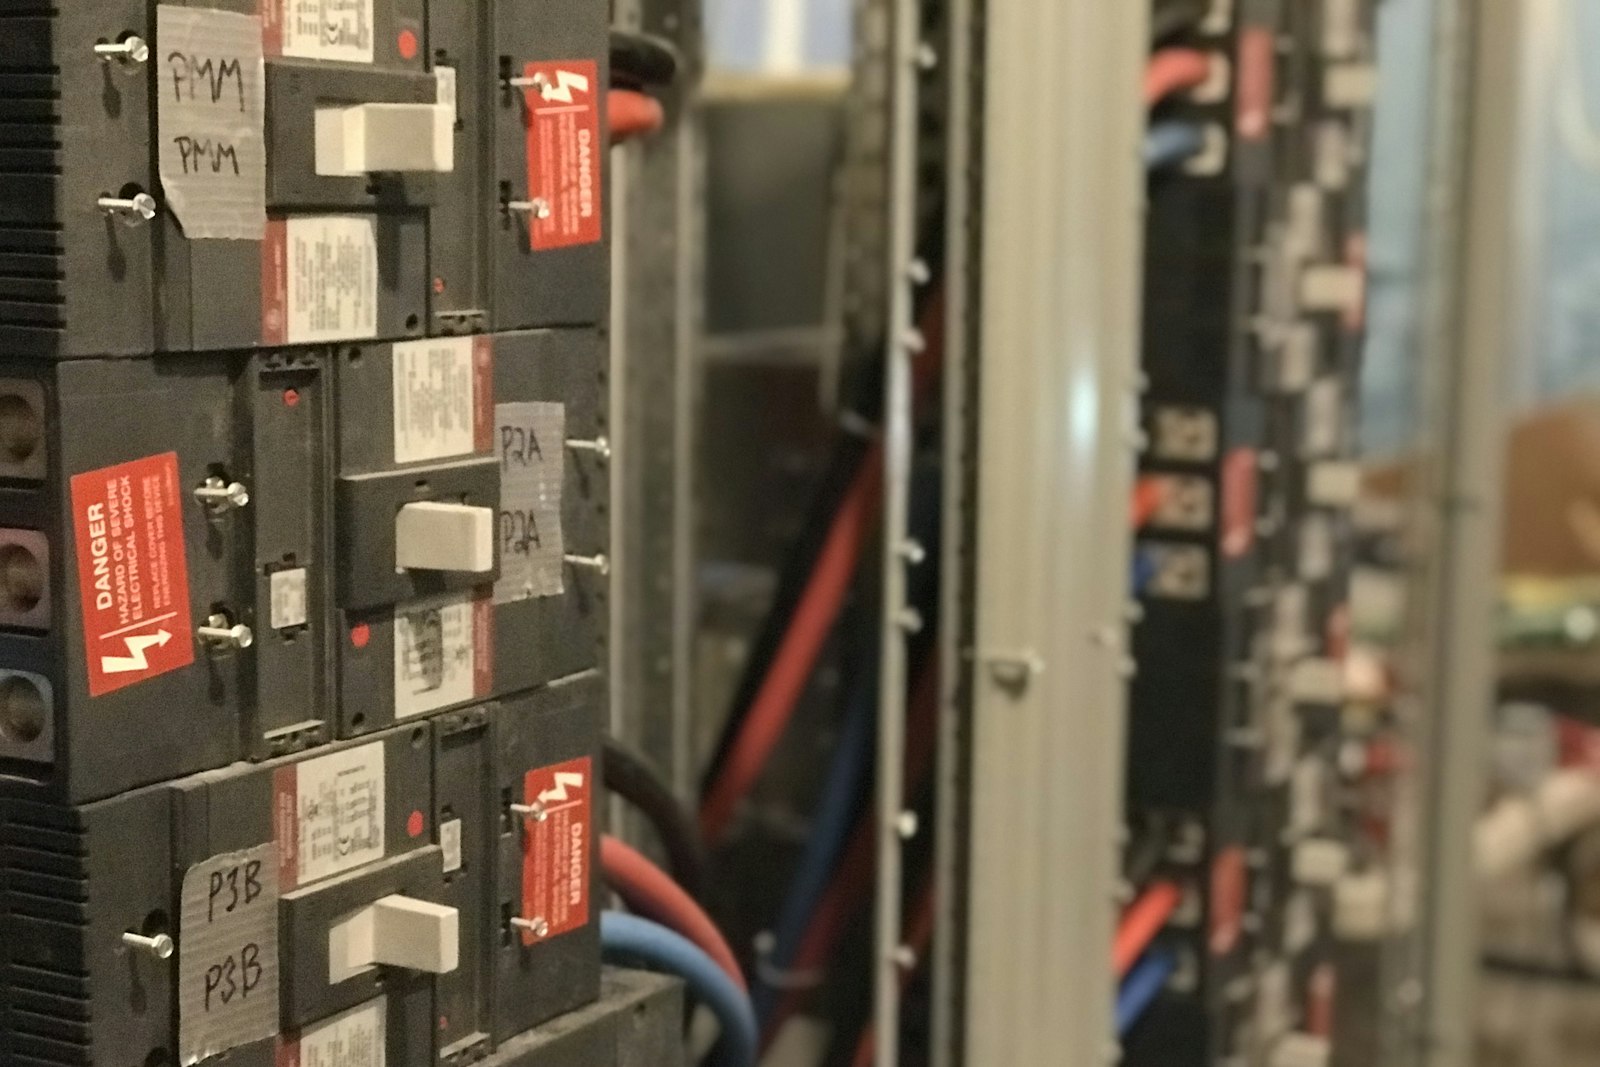
Electrical cabinet with tagged breakers
Site performance · this quarter
-8.4% vs expected
Weather normalizedBelow baseline
Demo data
Air and operations

Healthy zones and equipment that keeps running

  • Air by zone

    CO2, particulates and VOCs read against occupancy, with exposure tracked in zone-hours.

  • Faults and failures

    FDD for faults that happened, predictive maintenance for early signs before they do.

  • Assets and twins

    Every asset's state and health, inside a live twin built from what you actually have.
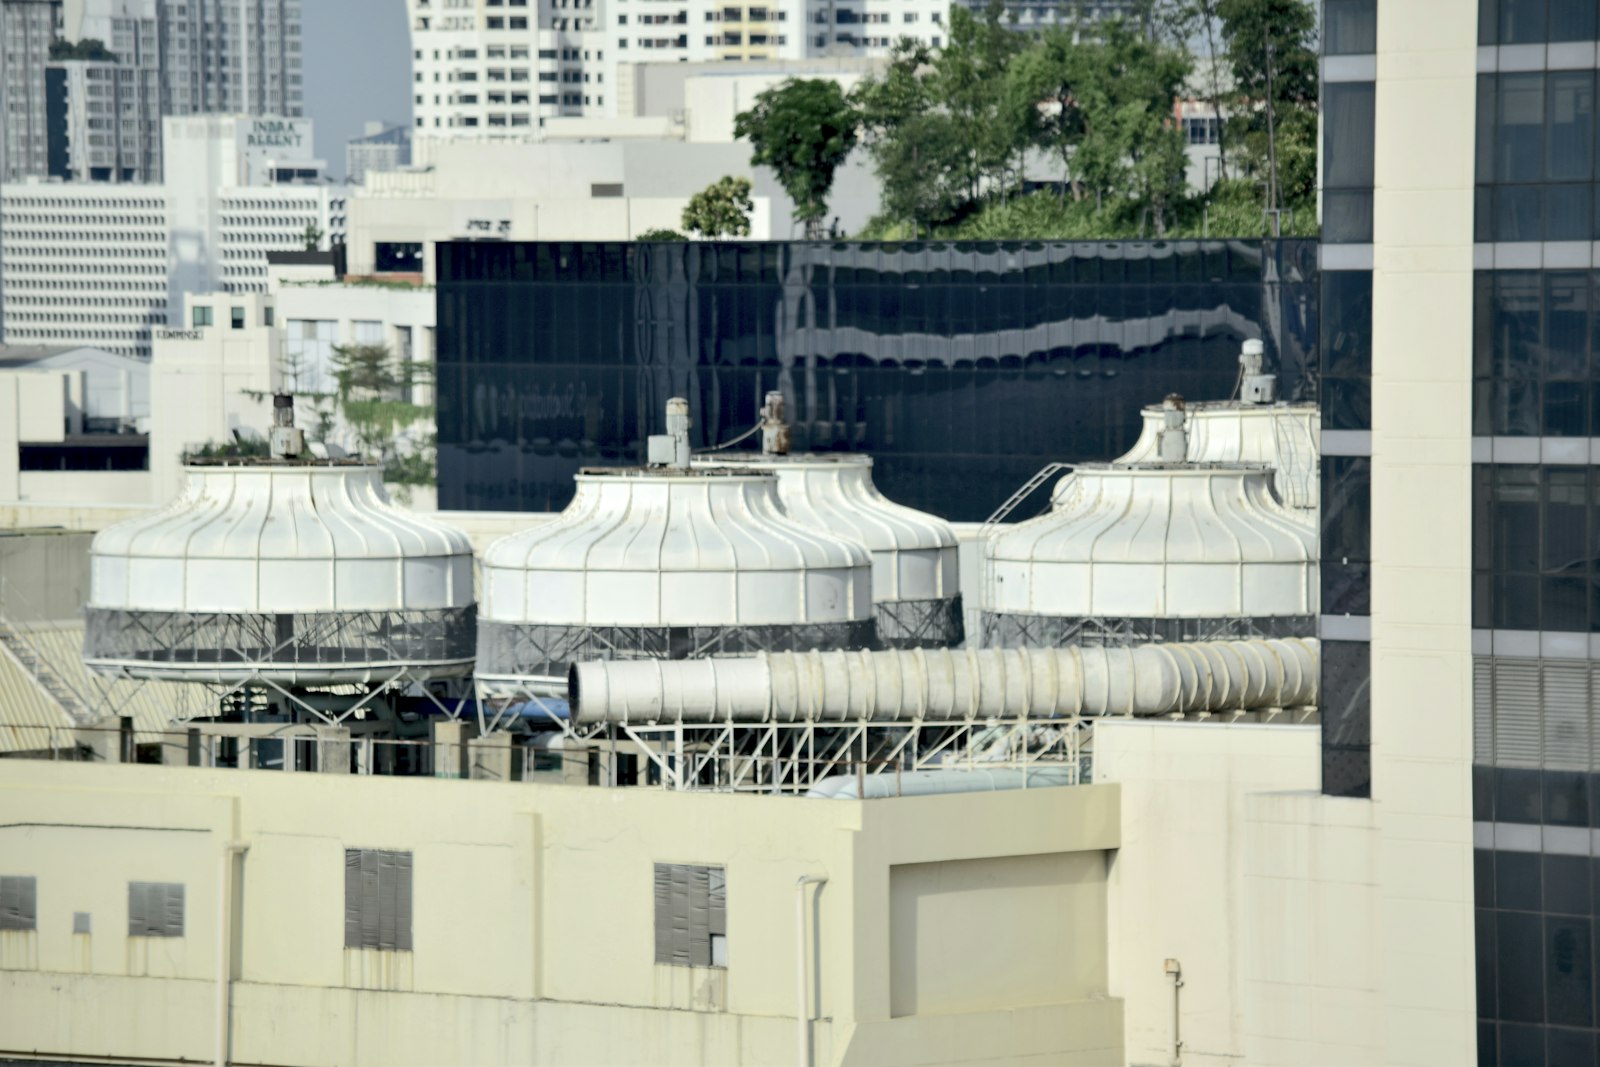
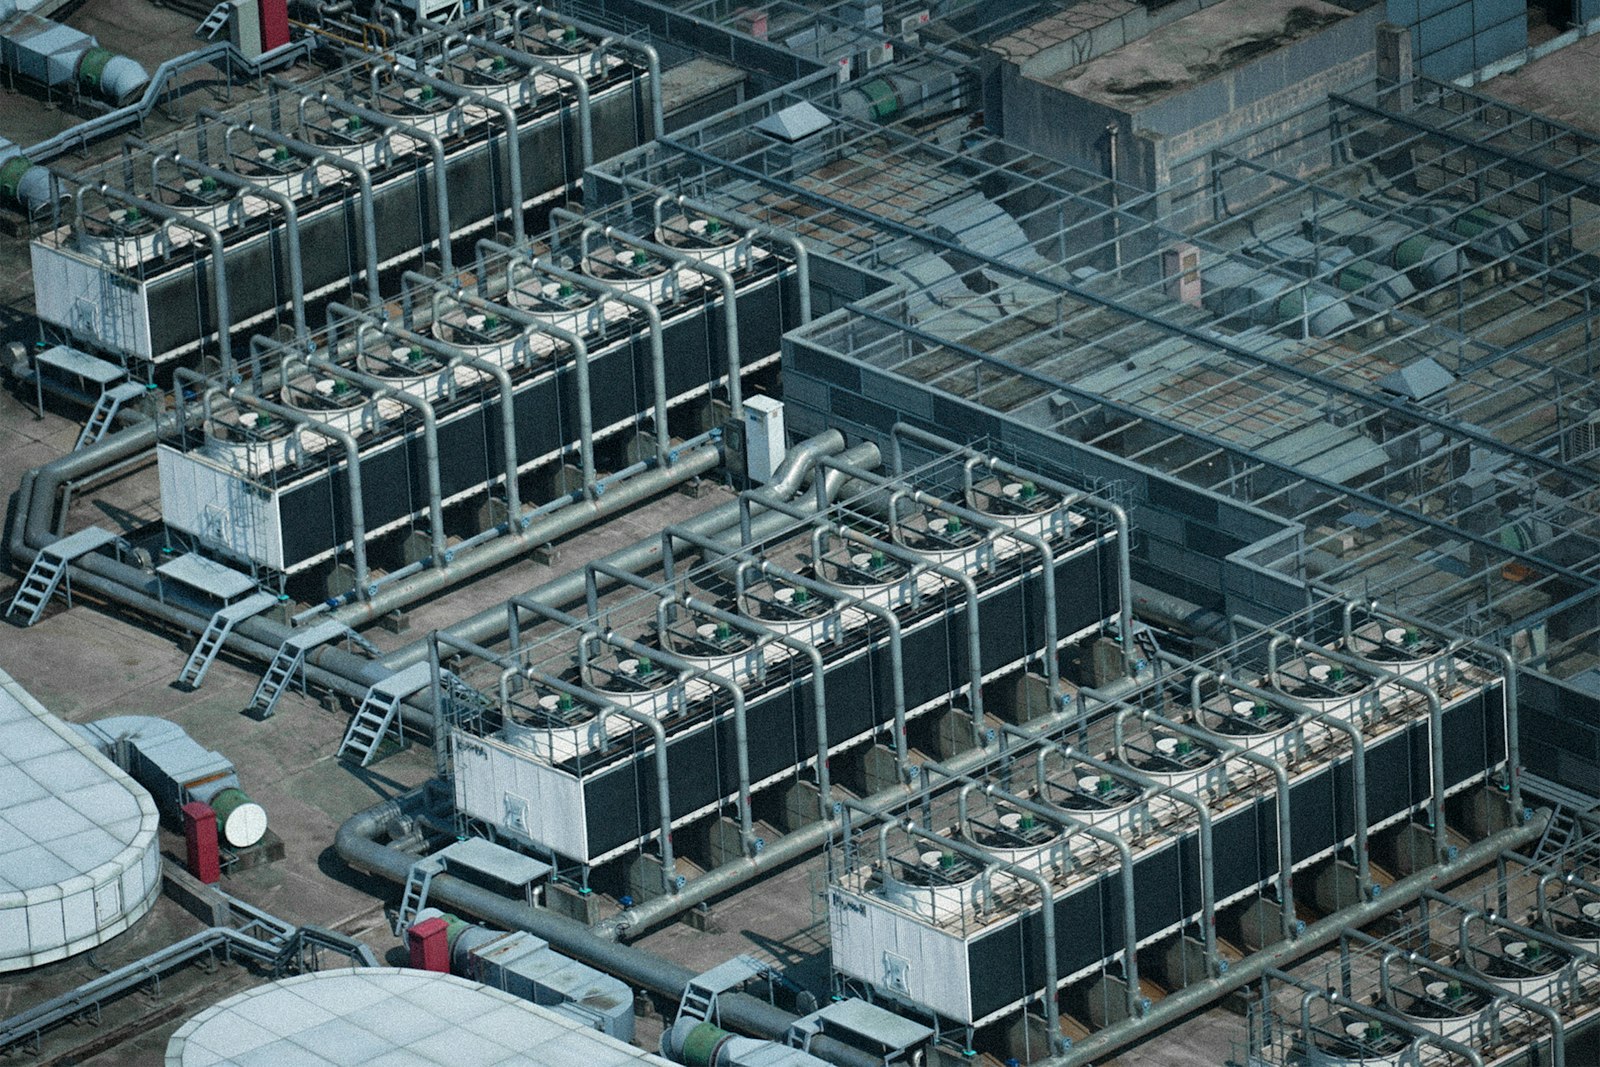
Rooftop cooling towers in a city
AHU-1 · fault
Supply fan stopped08:02
Failed rotor shaft08:03
Routed to CMMS08:04
Airflow confirmed11:40
Demo data
Old way vs the Aqueduct way

Point tools, before and after Aqueduct

The old way
  • Each problem gets its own tool and its own dashboard.
  • Alerts arrive with no diagnosis and no next step.
  • Water, energy and air data never meet in one place.
  • Savings are estimated, then reported as results.
  • Every new feature means another vendor and integration.

The Aqueduct way
  • Every feature reads from one data layer in aQ Core.
  • Each finding carries a cause and a recommended fix.
  • Water, energy and air sit side by side with equal weight.
  • Every saving is verified at the meter against a baseline.
  • New features switch on over the same connected devices.
Digital multimeter
What we believe

One loop for every feature: monitor, measure, identify, act, verify.

Talk to our team
Questions

Common questions

Aqueduct covers water (leak detection, water balance, non revenue water, burst detection), energy (weather normalized baselining, measurement and verification, peak demand, load disaggregation), air (IAQ, CO2, particulate and VOC monitoring) and operations (fault detection and diagnostics, predictive maintenance, asset observability, digital twins).

No. Features run on one data layer, aQ Core, so you can start with one outcome such as water or energy and add the rest later without a new integration.

It acts. Faults are routed into your CMMS with a recommended fix, setpoints and schedules adjust where control is enabled with owner approval, and every result is verified at the meter.

Milvian AI holds ISO/IEC 27001, ISO 9001:2015 and SOC 2 Type 2, is an AWS Advanced Tier Partner and can deploy on premises with AI on NVIDIA infrastructure.

See Aqueduct on your own facility.

Bring a site, a utility bill or a question. We will show you where the loss is.