Indoor air quality monitoring for buildings, zone by zone, with a response.
Indoor air quality monitoring measures what people breathe inside a building, continuously and per zone: CO2, particulates, VOCs, temperature and humidity. Aqueduct reads those levels against occupancy and duration, explains the cause in plain language with the standard behind it, and adjusts ventilation where control is enabled.
Measure air where people are, explain the cause, and respond with fresh air.
Every zone, every parameter, on the floor plan
- Full parameter set
CO2, VOC index, temperature, humidity and more, reported per zone on real CAD floor plans.
- Occupancy overlay
Air events are read against occupancy, so a spike in a full room outranks one in an empty room.
- Exposure in zone-hours
Time above target is counted, because a sustained level matters as much as a brief peak.
A finding, the standard behind it, and the response
- Why this rating
Each site rating comes with an explainer that names the driver and the standard used.
- Weather aware
When outdoor air is mild, Aqueduct says so, because more fresh air costs little right then.
- Costed action
The recommendation names the response: increase ventilation, raise outdoor air or check the economizer.
Boost fresh air where control is enabled, then relax
- Owner-approved rules
Ventilation changes run only under rules the owner has approved, through AHUs, RTUs or relay fans.
- Relax in range
Fresh air is boosted on threshold and relaxed once the zone is back in its target band.
- Exposure confirmed
Zone readings and exposure for the day confirm the response worked, with energy measured alongside.
Indoor air, before and after Aqueduct
- A spot test on a quiet day stands in for the year.
- Readings ignore whether anyone was in the room.
- Dashboards show peaks, not how long people breathed it.
- A red tile appears and nobody knows what to do.
- Ventilation runs on a fixed schedule, full rooms or empty.
 The Aqueduct way
- Continuous zone readings show the real curve, every day.
- Occupancy overlay weights events by whether people were there.
- Exposure in zone-hours shows how long levels stayed high.
- Each finding names the cause, the standard and the action.
- Fresh air follows the zone, where control is enabled.
What indoor air looks like without Aqueduct
Air quality is usually checked once, or only after a complaint.
Snapshots, not the real curve
A spot test on a quiet day says little about air during full occupancy or production.
Readings without context
A CO2 spike in an empty room does not matter. The same spike in a full classroom does. Most systems cannot tell them apart.
Peaks, not exposure
For air, how long a level lasts matters as much as how high it goes. Dashboards show the peak.
Alerts with no action
A red tile appears. Nobody knows whether to open dampers, check the economizer or ignore it.
How IAQ monitoring works
Powered by aQ AirSafe, with Smart Controls where ventilation control is enabled.
Sense every zone
Air quality sensors measure CO2, VOC index, temperature, humidity and other parameters such as carbon monoxide and particulates, depending on the device. A zone is the area a sensor speaks for.
Overlay occupancy
Occupancy comes from sensors or a defined schedule. Air events are weighted by whether people are present.
Track exposure, not just level
Concentration is shown over time with a min, max and average band, and exposure is tracked in zone-hours.
Explain the cause
The analytics page gives a plain-language finding, the standard behind the rating, outdoor conditions and a costed action, with a why-this-rating explainer.
Respond and verify
Where control is enabled, ventilation is boosted through AHUs, RTUs or relay-switched fans, then relaxed when the zone is back in range.
One air event, start to finish
An illustrative incident in a conference wing.
Zone sensors report CO2, VOC, temperature and humidity in each meeting room.
CO2 in one room climbs and stays high through an occupied afternoon.
Occupancy is high and outdoor air is mild. Aqueduct recommends raising outdoor-air supply and notes it is low-cost right now.
Under an owner-approved rule, the AHU serving the wing raises its outdoor-air damper. The command is logged.
CO2 in the room returns to its target band, and exposure for the day is recorded in zone-hours.
Problem, solution, impact
Spot tests that miss real conditions.
Continuous zone-level monitoring overlaid with occupancy.
Air quality known when people are actually in the room.
Over-ventilating everywhere to be safe.
Ventilation that follows occupancy and measured air.
Air targets met without burning energy.
Complaints with no evidence.
Zone history, exposure and a plain-language cause.
Faster answers to occupants, backed by data.

What you get
Per-zone readings
CO2, VOC, particulates, temperature and humidity where sensors measure them.
Occupancy overlay
Events weighted by whether people are present.
Exposure in zone-hours
Duration counted, not just the peak.
Plain-language findings
The cause, the standard behind it and a costed action.
Ventilation response
Boost and relax through connected equipment, where enabled.
Certification evidence
Continuous zone-level records. We supply the metrics; you file.
Where it fits
- IAQ monitoring platforms
- BAS ventilation schedules
- CMMS
- BMS and BAS points
We don't make sensors. We use IoT to sense and act. Control only where enabled and with owner approval.
Related standards
Aqueduct supplies continuous metrics for these standards. Check the current version.
Where teams put it to work
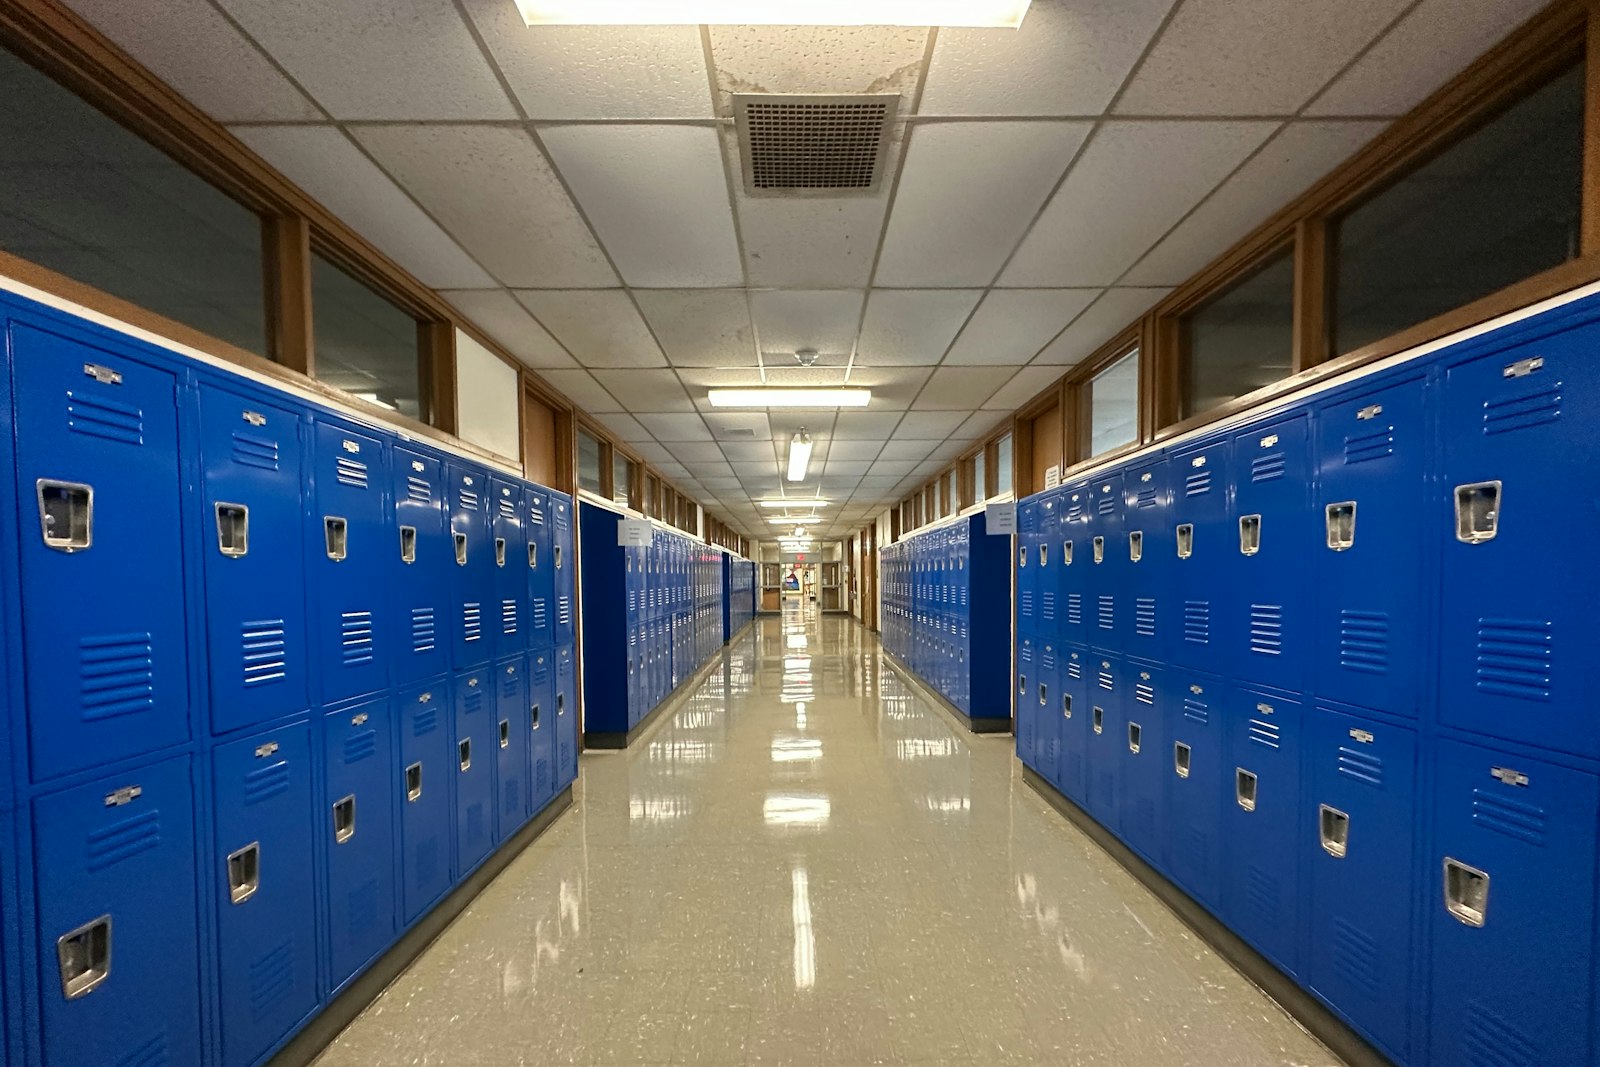
Classrooms ventilated when they are full
CO2 and occupancy per classroom show which rooms need more air during lessons, so ventilation follows the timetable, not a fixed rate.
Learn more
Meeting rooms that stay fresh all afternoon
Busy meeting rooms get fresh air when they fill up, and quiet floors stop being over-ventilated, with exposure recorded per zone.
Learn more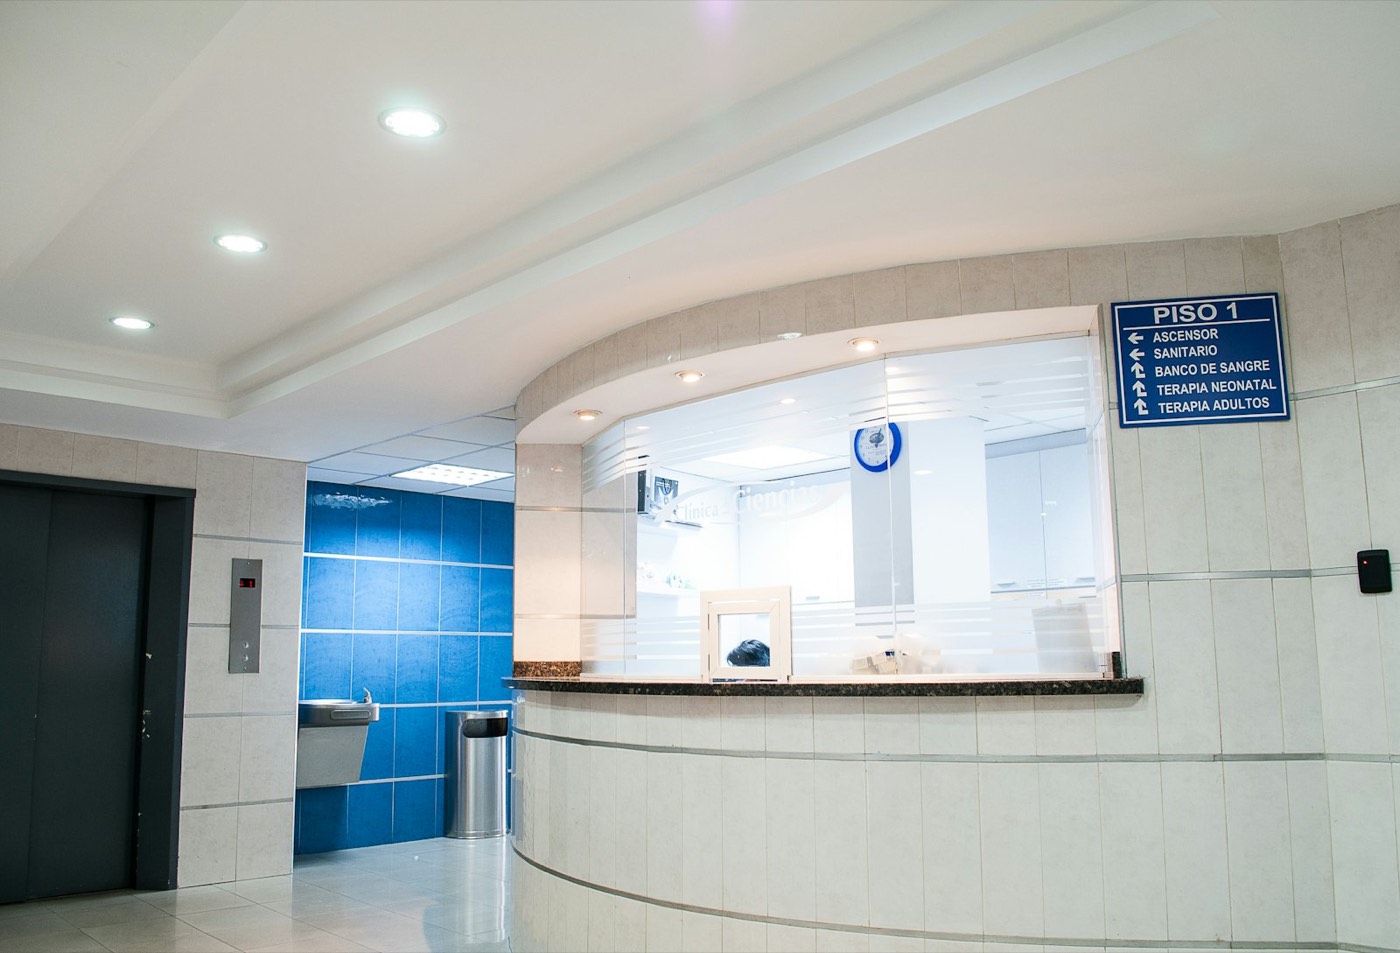
Air tracked in waiting areas and wards
Waiting rooms, wards and corridors are monitored continuously, with findings routed so facilities can respond before complaints start.
Learn moreRelated
Common questions
Typically CO2, particulates such as PM2.5, VOCs, temperature and humidity, and on some devices carbon monoxide, pressure, light and sound. Aqueduct reads whatever the installed sensors report.
A high reading in an empty space is low risk. The same reading during full occupancy is what affects people. Aqueduct weights air events by occupancy.
Yes, where control is enabled and the owner approves, through AHUs, RTUs and VAV boxes over Modbus or BACnet, or fans on LoRaWAN relays.
Where there is a pattern, such as a cafeteria at lunch, yes. Many air events are environmental and not predictable, so continuous monitoring and fast response matter more.
No. It supplies continuous zone-level records for frameworks such as WELL and RESET. You file.
See Aqueduct on your own facility.
Bring a site, a utility bill or a question. We will show you where the loss is.