Building analytics software for engineers, with live twins and real control
Building analytics software for engineers turns meter, sensor and controller points into diagnosis. Aqueduct models the real system block by block, a water balance, an electrical single line and per-RTU component states, reads BACnet, Modbus, MQTT and LoRaWAN, diagnoses faults, and controls equipment where control is enabled with owner approval, with every command logged.
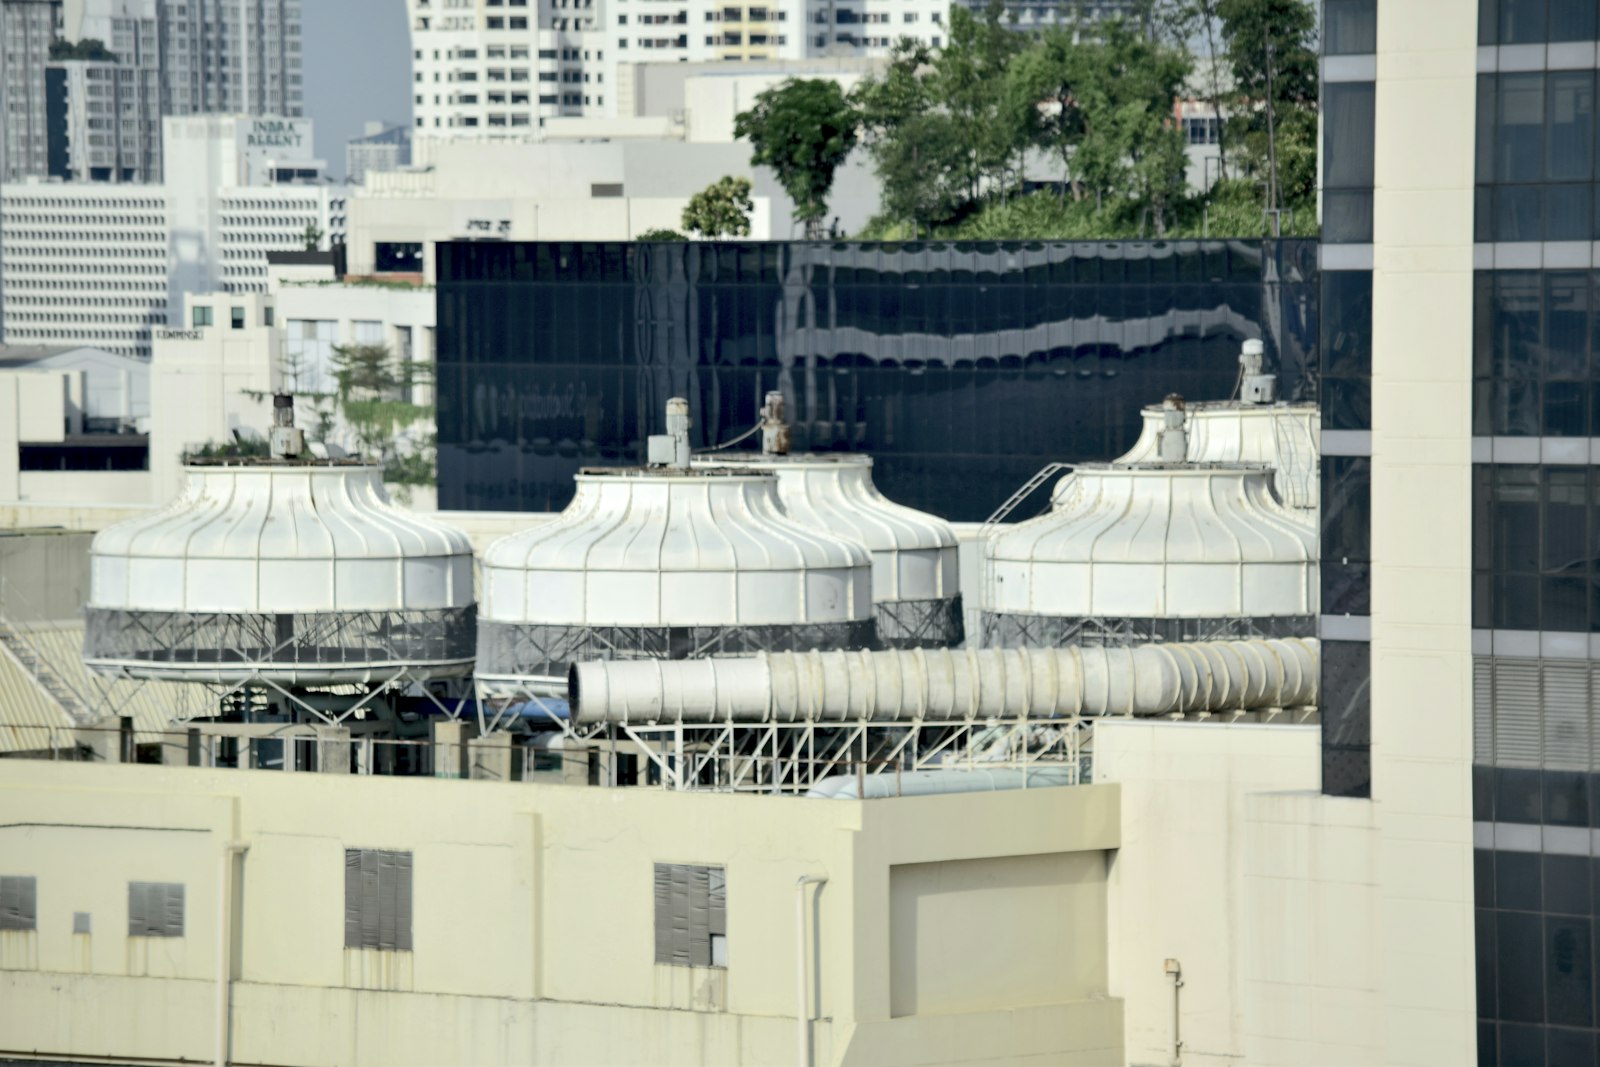
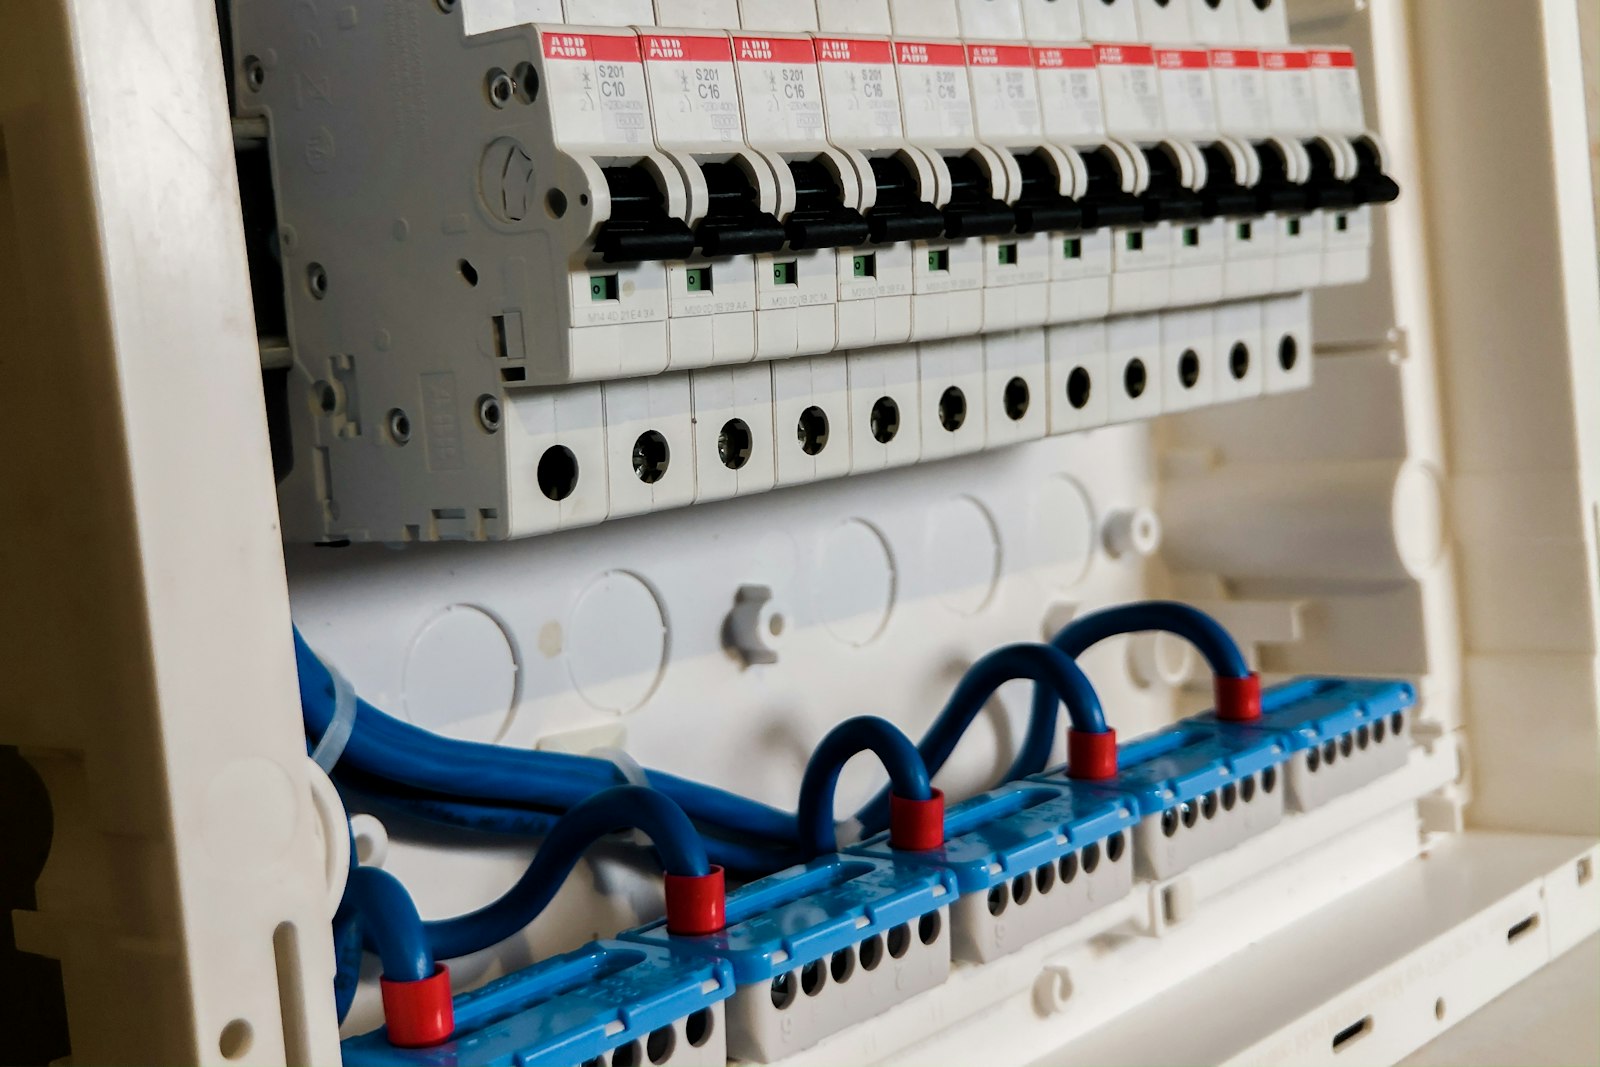
A model of the real system, so every fault has a location and a cause.
The system modeled block by block, the way it is installed
- Water balance equation
Supply, floors, fire system, RO feed and unaccounted loss shown as one live equation.
- Electrical single line
Sources, switchboard and feeders with power factor and loading against rated kVA.
- RTU states
Mode, economizer, cooling, heating and fans shown as components, not raw telemetry points.
Faults explained, ticketed and confirmed closed
- Plain-language findings
Each fault states the component, the evidence and the likely cause in operator language.
- Early signs of failure
Vibration, sound signature and energy drift schedule maintenance before the equipment stops.
- Confirmed by the twin
After the repair, attainment and airflow must return to target before the fault closes.
Commands with lockouts, schedules and an audit trail
- Two control paths
LoRaWAN relays for simple loads, field device controllers over Modbus or BACnet for complex equipment.
- Occupancy-driven rules
Automations trigger on device thresholds or on site, zone or floor occupancy.
- Command history
Every command and its result recorded, with lockouts that block short cycling.
Building engineering, before and after Aqueduct
- Thousands of points, no model of how they connect.
- Every vendor brings a protocol and a separate login.
- Faults arrive as hot calls from occupants.
- Overrides at the panel leave no record.
- Savings from a retrofit are estimated, not measured.
 The Aqueduct way
- A live twin models the system block by block.
- BACnet, Modbus, MQTT and LoRaWAN on one data layer.
- Faults arrive diagnosed, located and ticketed.
- Every command is logged with its result.
- Savings are measured against a weather-normalized baseline.
What engineers fight with today
The data exists. Getting it into one model you can reason about is the hard part.
Points without a model
Trend logs list thousands of points with cryptic names and no picture of how the system actually connects.
Every vendor, a new protocol
BACnet here, Modbus there, pulse meters on the water side, and a LoRaWAN pilot nobody integrated.
Faults found by complaint
A stuck damper or a short-cycling compressor shows up as a hot-call ticket, not as a diagnosis.
Control without an audit trail
Overrides are made at the panel and nobody can say later what changed, when, or whether it executed.
What engineers get from Aqueduct
A model of the real system, built block by block to match what is installed.
Water digital twin
Main Supply equals All Floors plus Fire System plus RO Feed plus Unaccounted Loss, live.
Learn moreElectrical single line
Grid, solar and backup sources balanced against HVAC, lighting, plugs, services and losses.
Learn moreRTU component states
Damper, cooling, heating and fan states with setpoint attainment and comfort compliance.
Learn moreOpen protocols
BACnet, Modbus, MQTT, M-Bus, pulse and LoRaWAN through gateways and field device controllers.
Learn moreLoad disaggregation
Feeder and equipment loads separated so you see which system drives the curve.
Learn moreAudited control
Schedules, automations and lockouts, with command history showing what executed.
Learn moreQuestions engineers ask
“How does Aqueduct actually control equipment?”
Two ways only: LoRaWAN relay switches for simple loads such as fans, and a field device network controller speaking Modbus or BACnet to AHUs, RTUs, chillers and VAV boxes. Control runs only where enabled, with owner approval.
“Can I specify Aqueduct into a new building?”
Yes. Aqueduct can be built in at design stage, so meters, sub-meters and controllers are specified once and the digital twin matches the drawings at handover.
“Does it show power quality or just kWh?”
Power monitoring devices report kW, kVAR, kVA, power factor, voltage, current and imbalance. The electrical twin shows loading against rated kVA per feeder.
“How do I know a command actually executed?”
Command history records each command and its result, and lockout warnings block new commands while one is still being acted on, which protects equipment from short cycling.
How Aqueduct shows up in an engineer's week
An illustrative week for a controls engineer across several sites.
Monday
The fault log shows an RTU with low setpoint attainment over the weekend. The twin shows the economizer damper stuck at minimum.
Tuesday
A ticket with the diagnosis routes into the CMMS. After the repair, setpoint attainment recovers and the fault closes as confirmed.
Wednesday
An automation rule is built: when floor occupancy drops, raise the cooling setpoint. It runs where control is enabled, with owner approval.
Thursday
A compressor shows rising vibration and energy drift. Maintenance is scheduled before it fails.
Friday
The engineer asks aQ Assistant how this week's HVAC energy compares with the last four, and gets a table with a data quality note.
Features and industries engineers use most
The depth sits in these pages.
Where teams put it to work
RTU faults found from component states
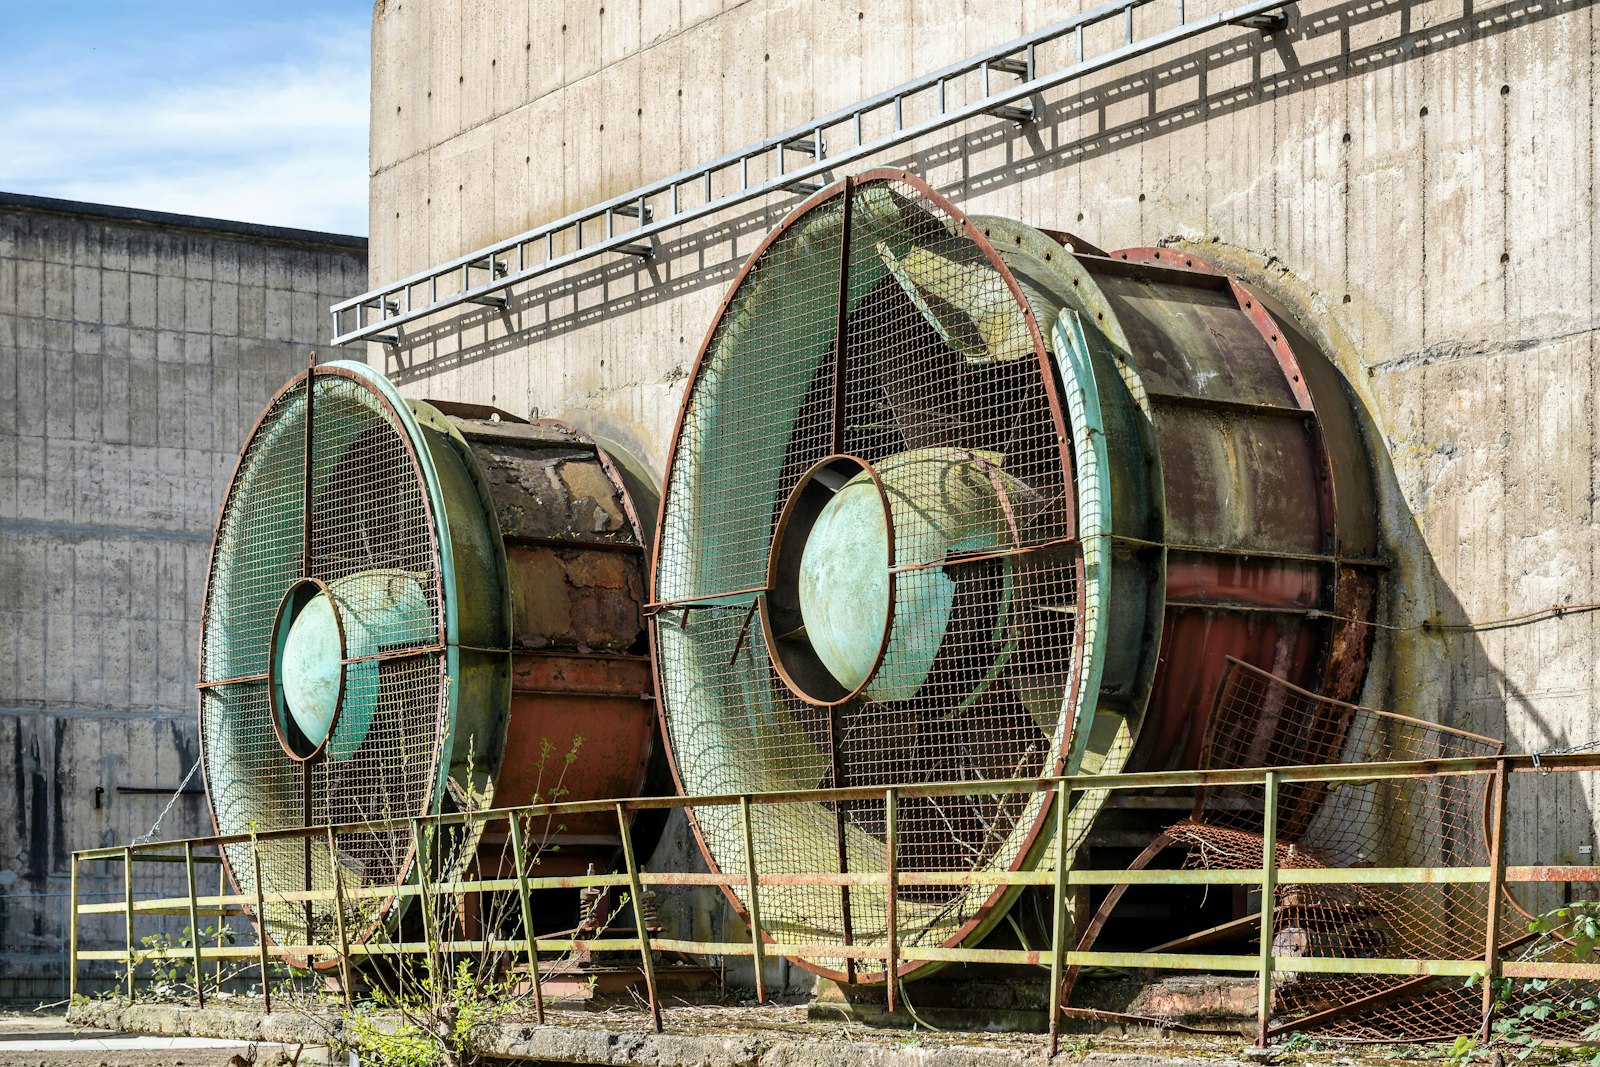
Economizer, compressor and fan states on the RTU twin show which component is failing before a hot call comes in.
Learn more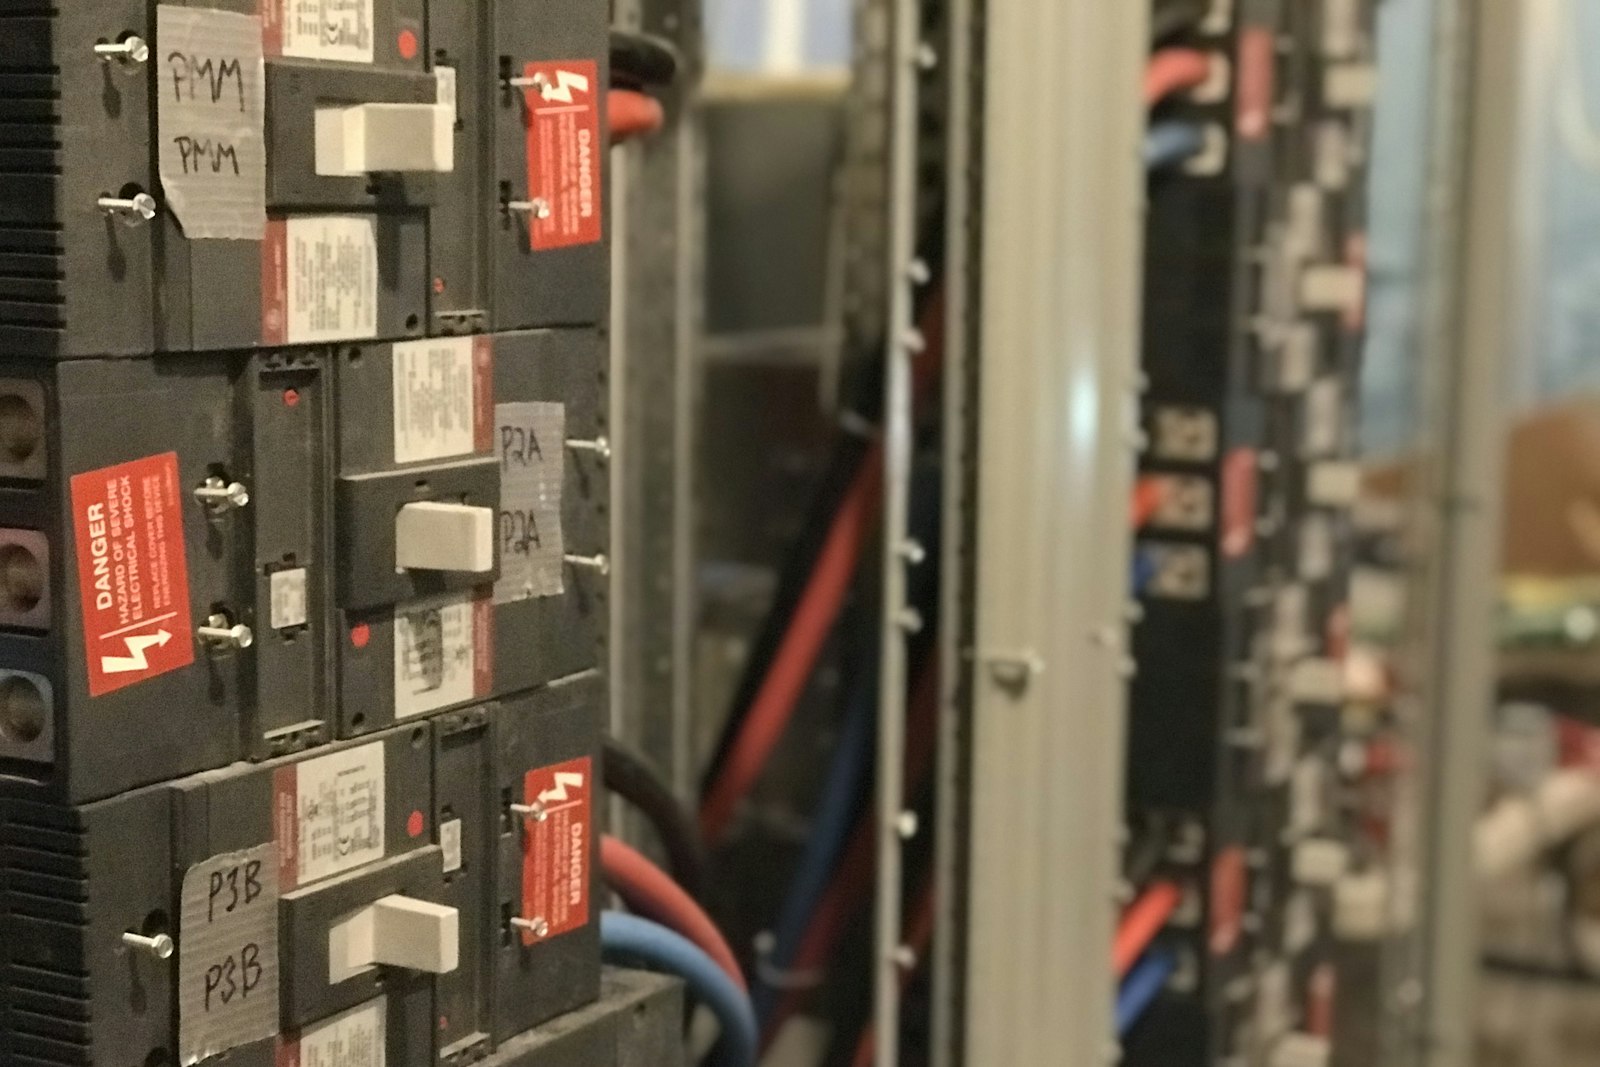
Feeders loaded against their rating
The electrical twin shows power factor and loading per feeder, so engineers see where demand and losses actually come from.
Learn more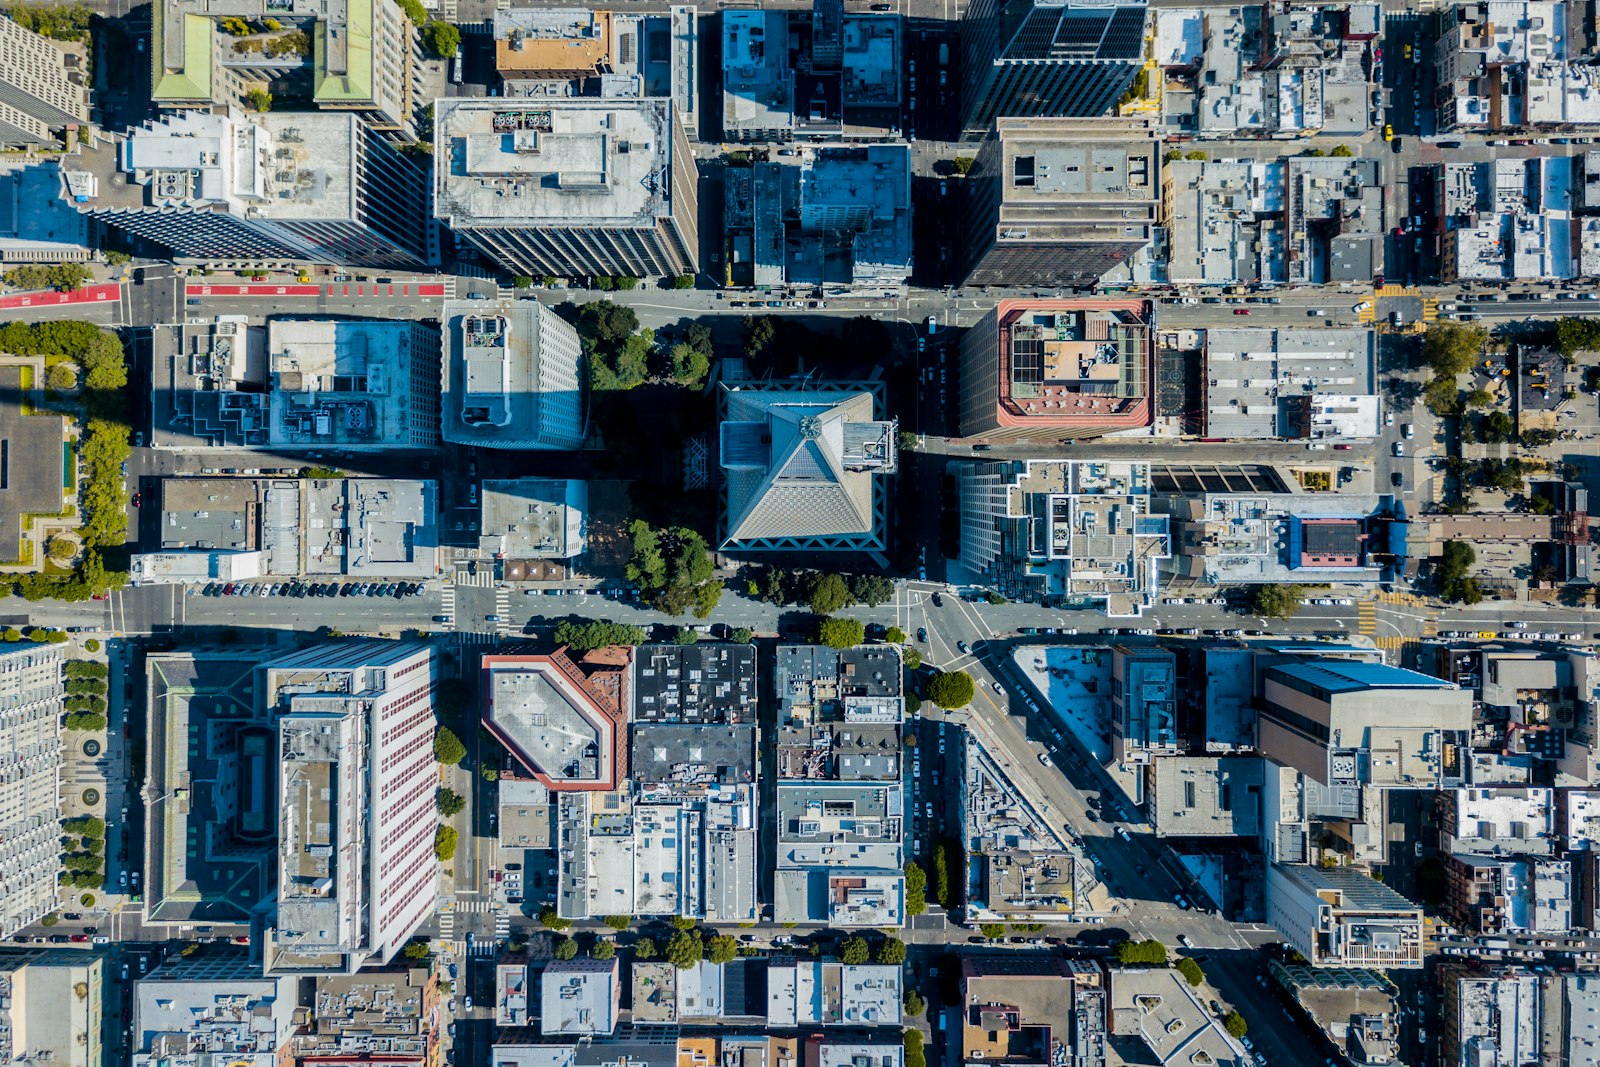
Specified once, modeled at handover
MEP teams specify meters and controllers at design, so the Aqueduct twin matches the drawings on the first day of operation.
Learn moreThe systems an engineer models, and what each one hides
Each block on the twin matches something installed. Here is what goes wrong quietly in each, what gets measured, and what Aqueduct does with it.
Chilled water plant
Low delta T: pumps move more water for the same cooling and the plant loses efficiency
Feeder kW, BTU meter flow, supply and return temperatures
Trends delta T against load and kW per ton per chiller
Rooftop units
Economizer stuck at minimum, units cooling empty floors
Mode, damper position, supply air temperature, fan status
Shows component states and setpoint attainment on the RTU twin
Air handlers
Valves and dampers not following command, filters left in alarm
Command against feedback, differential pressure, airflow
Lists actuators that disagree with their command
Electrical distribution
Poor power factor and feeders loaded far from rated kVA
kW, kVAR, kVA, voltage, current, imbalance per feeder
Draws the single line with loading and power factor per node
Domestic water
Slow leaks and overflows that never trigger a threshold
Main supply and sub-meters on floors, risers and lines
Closes the water balance and tracks unaccounted loss
Treatment plant
RO recovery falling as membranes foul, reuse assumed rather than measured
RO feed, permeate, reject, TDS; STP inlet, treated flow, BOD out
Puts recovery and STP efficiency on the same twin as supply
Rotating equipment
Bearing wear and imbalance developing for weeks before a trip
Vibration, sound signature, energy per unit of work
aQ PredictIQ schedules maintenance before failure
Zones
Comfort complaints with no record of what the zone actually did
Zone temperature, CO2, occupancy
Ties comfort compliance to the unit serving the zone
The control and plant KPIs on the twin
The KPIs that separate a working control sequence from one that only looks fine on a graphic.
| KPI | How it is derived | What a bad value usually means |
|---|---|---|
| Setpoint attainment | Share of time a unit holds its setpoint | Undersized capacity, a stuck damper or a fighting sequence |
| Comfort compliance | Share of occupied time zones stay in band | Control is saving energy at the occupants' expense |
| Sequence exceptions | Count of steps that ran out of order | Logic changed at the panel or a sensor gone bad |
| Short-cycle events | Starts within a short window of a stop | Tuning issue, now blocked by lockouts |
| kW per ton | Electrical input against BTU meter cooling output | Fouled condenser, low delta T or poor staging |
| Power factor and loading | Per feeder against rated kVA | Reactive penalty risk and badly placed correction |
| Unaccounted loss | Supply minus every metered use | A leak, an overflow or an unmetered connection |
How engineers use Aqueduct beyond fault finding
Commissioning evidence
Command history and component states show whether a sequence actually ran as designed after handover, not only on the test day.
Design-stage specification
Meters, sub-meters and controllers are specified once, so the twin matches the drawings at handover.
Learn moreRules you build yourself
If and else logic on device thresholds or occupancy, with severity, scope and lockouts, running only where control is enabled with owner approval.
Clusters for real systems
Group an RTU with its zone sensors so the sensor reading informs the unit and the cluster is analyzed as one system.
sites in 21 countries run on Aqueduct.
and 9 clinics in one of India’s top hospital chains.
US airport running water intelligence on Aqueduct.
of commercial real estate under Aqueduct.
FMCG manufacturing campus.
operations run on Aqueduct.



Related
Common questions
It is software that turns BMS, meter and sensor points into a model engineers can diagnose from. Aqueduct builds live digital twins of the water system, the electrical single line and individual RTUs, then runs fault detection and verified control on top of them.
Yes. Aqueduct talks BACnet and Modbus through a field device network controller, and also reads MQTT, M-Bus, pulse outputs and LoRaWAN devices. Data refreshes every 60 seconds.
A BMS graphic shows points on a picture. Aqueduct's twin models the physical system and its balance, for example Main Supply equals All Floors plus Fire System plus RO Feed plus Unaccounted Loss, so the gap itself becomes the diagnostic signal.
FDD acts after a fault: it finds, diagnoses and routes the fix, then confirms it. Predictive maintenance acts before failure: vibration, a new sound signature or energy drift schedules maintenance first.
Yes. The rule builder sets thresholds on a device or on site, zone or floor occupancy, with if and else logic and actions. Rules run only where control is enabled, with owner approval.
Yes. Aqueduct can be built in at design stage, so metering, sub-metering and controls are specified once and the digital twin matches the installed system at handover.
It can replace or work across the BMS. Field controllers stay as the control layer for equipment, and Aqueduct supervises, analyzes and commands them where control is enabled.
It divides electrical input on the chiller feeder by cooling output from BTU meter flow and header temperatures. Where feeders are not split per chiller, it reports plant-level efficiency instead.
A cluster groups devices and sensors so they operate and are analyzed as one system. For example, a pressure sensor linked to an RTU can trigger a filter change alert for that unit.
Yes. Component states on the twin and command history show each step, whether it executed and when, and sequence exceptions count the steps that ran out of order.
No. The twin is built block by block, and blocks without a reporting meter show as no data. Coverage grows as points are added, and the balance becomes more precise.
See Aqueduct on your own facility.
Bring a site, a utility bill or a question. We will show you where the loss is.