PM2.5 monitoring for workplaces and plants, during real operations.
PM2.5 monitoring measures fine particles in the air, the size most associated with health effects, alongside coarser PM10. Aqueduct measures particulates continuously per zone while operations are running, tracks how long levels stay high, and traces spikes to the process, shift or outdoor condition behind them.
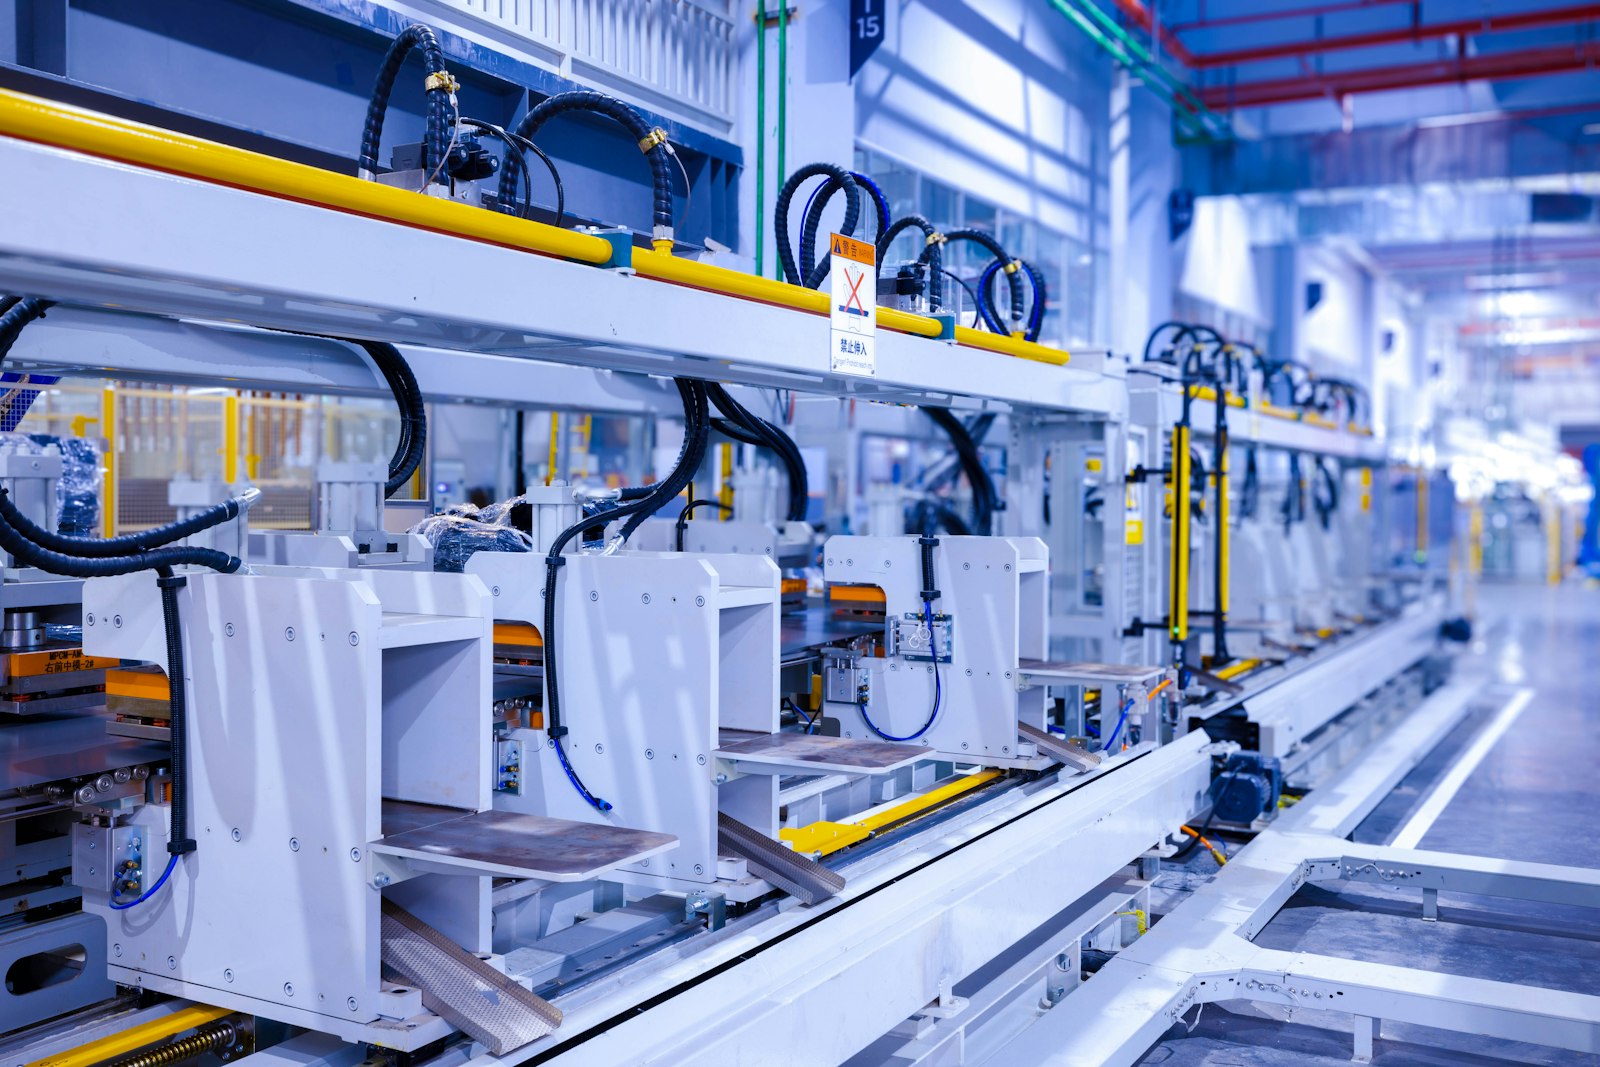
See particulates during real operations, trace the source, and confirm the fix.
Readings taken while the line is running
- Through every shift
PM2.5 and PM10 are recorded continuously, including the hours when production is at full speed.
- Min, max and average
Each zone shows a band from minimum to maximum with the average line, against air quality bands.
- Duration counted
Time above target is tracked as exposure, because a sustained level matters more than one reading.
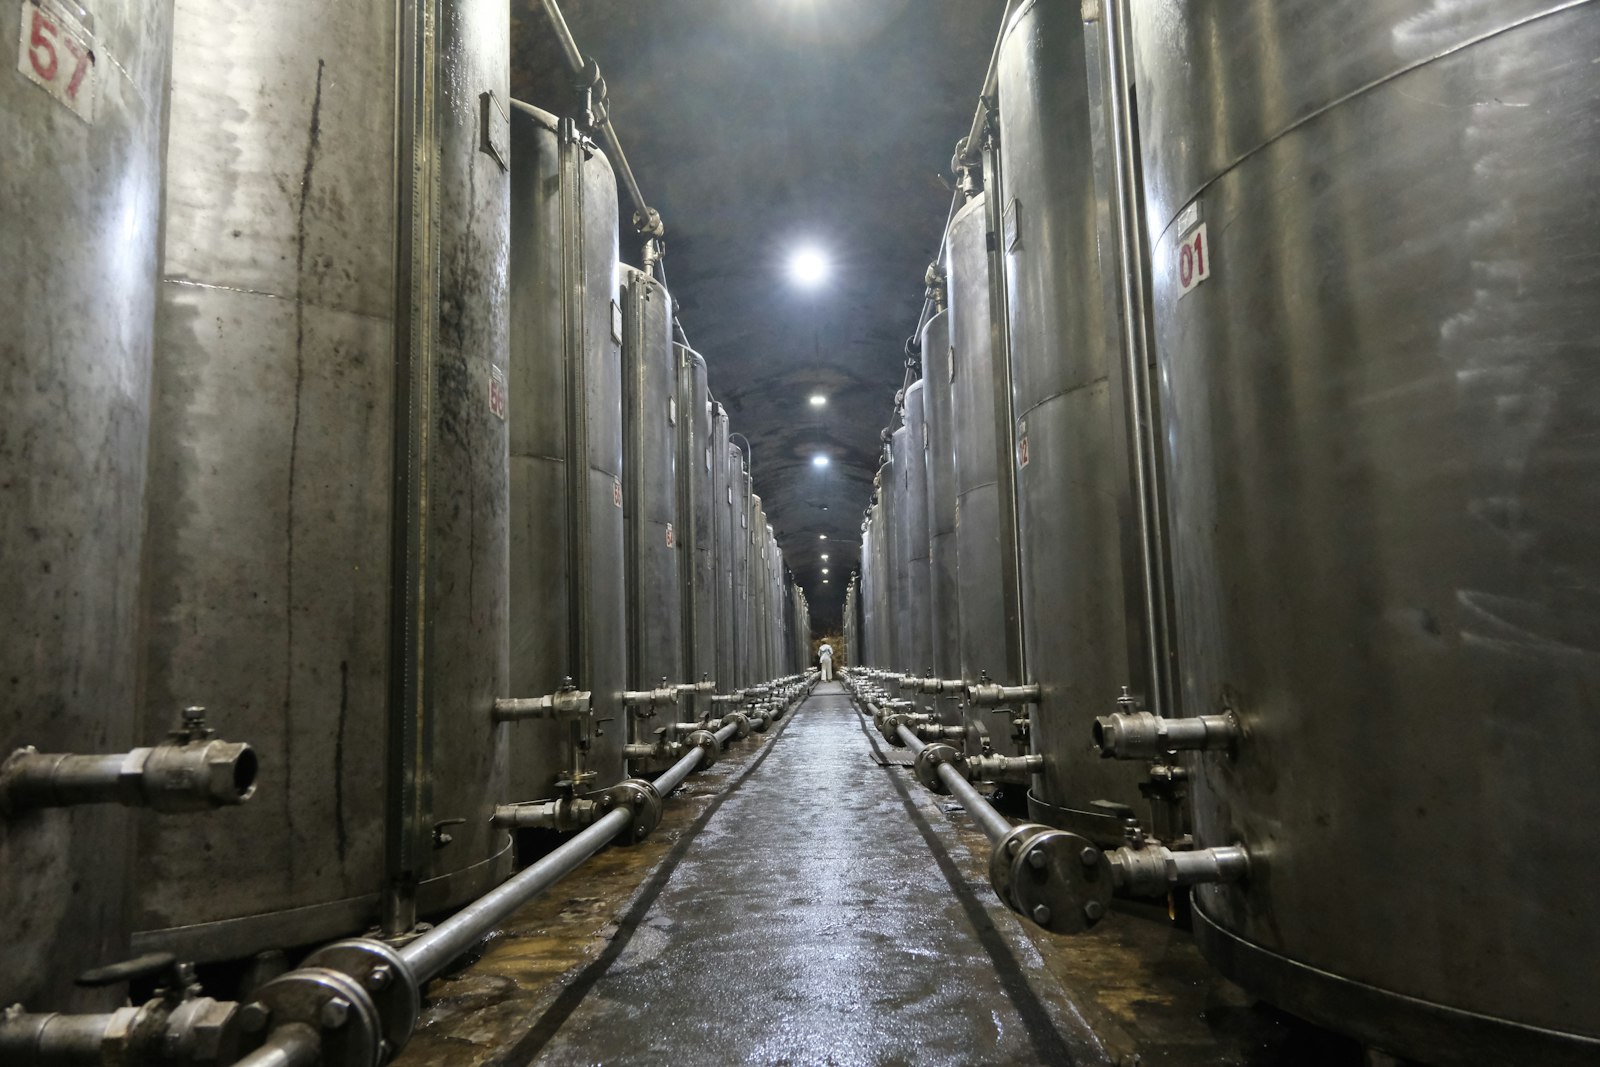
Tie a spike to a machine, a step or a door
- Aligned with production
Spikes are lined up with schedules and line run times, so the source process is named.
- Outdoor context
Outdoor conditions sit alongside indoor readings, so teams know whether more outside air helps or hurts.
- Off-shift comparison
Low readings when the line is stopped confirm the source is the process, not the building.
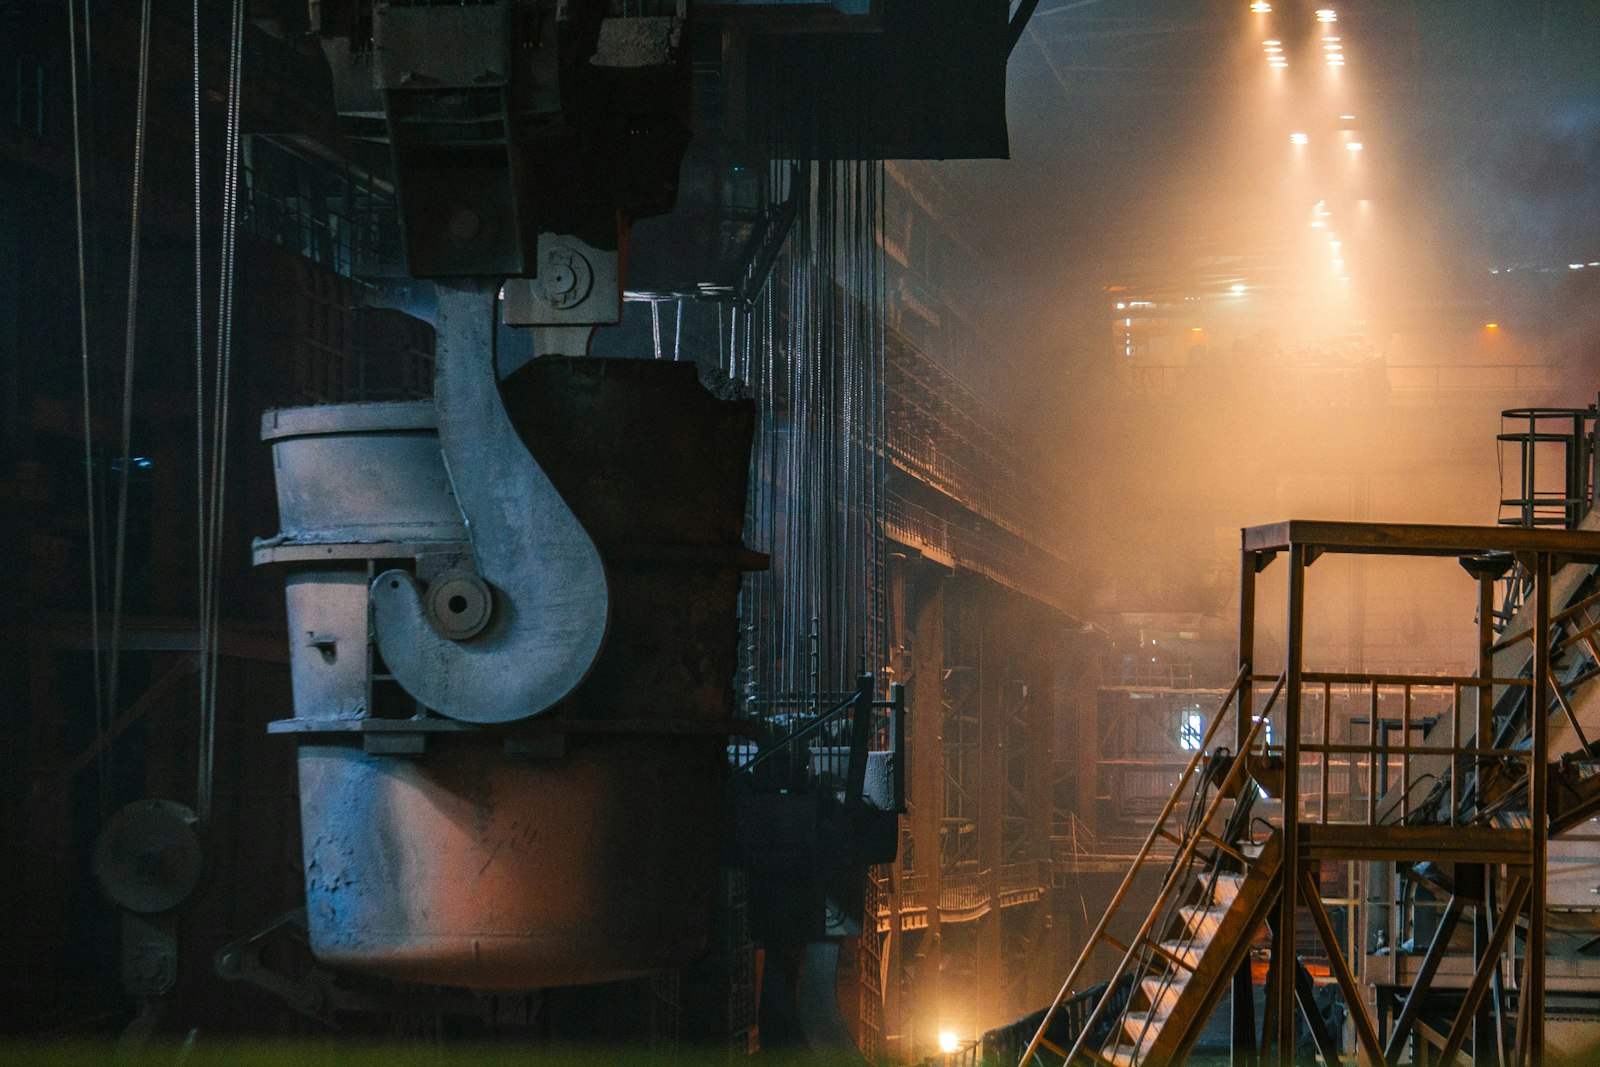
Maintenance triggered by what the air shows
- Filters by condition
A pressure reading from a linked sensor can trigger a filter change instead of a calendar date.
- Extraction checked
Tickets for local extraction or filtration go into your CMMS with the zone trace attached.
- Confirmed after service
After service, readings near the line must stay within target through the next shifts.

Particulates, before and after Aqueduct
- A good reading is taken on a weekend with production stopped.
- A high reading cannot be tied to any machine or step.
- Nobody knows if outside air will help or make it worse.
- Filters are changed on a calendar, not on condition.
- After a repair, nobody checks the next shift's air.
 The Aqueduct way
- Continuous readings show the air while production runs.
- Spikes are aligned with the line and the process step.
- Outdoor conditions are shown beside every indoor reading.
- Pressure and air readings trigger filter changes when needed.
- Readings through the next shifts confirm each repair.
What particulates look like without Aqueduct
A particulate test is often taken when the plant is quiet.
The weekend reading
A good result measured with production stopped says nothing about the air during a shift.
No link to the source
A high reading cannot be tied to a machine, a process step or an open door.
Outdoor air blamed or ignored
Without outdoor context, it is unclear whether bringing in more air will help or hurt.
Filters changed on a calendar
Filtration is serviced by date, not by what the air and pressure readings show.
How particulate monitoring works
Powered by aQ AirSafe on the aQ Core data layer.
Measure where people work
Particulate sensors are placed by zone on the floor plan, near processes and where people spend their shift.
See the real curve
Concentration is shown over time with a min, max and average band against air quality bands, during operations as well as off-hours.
Count duration
Time above target is tracked as exposure, because sustained levels matter as much as peaks.
Trace the source
Spikes are aligned with occupancy, schedules and production patterns, and compared with outdoor conditions.
Act and confirm
Recommendations route to your CMMS, such as a filter change triggered by a pressure reading. Ventilation or extraction responds where control is enabled.
One particulate event, start to finish
An illustrative incident at a metal-working plant.
Particulate sensors report from zones across the production floor.
PM2.5 near one line rises each time the line runs and stays above target for most of the shift.
Off-shift readings are low and outdoor levels are normal. Aqueduct ties the spike to that line's operation.
A ticket goes to the CMMS to inspect local extraction on the line, with the zone trace attached.
After service, PM2.5 near the line stays within target through the next shifts.

Problem, solution, impact
Results that reflect quiet periods.
Continuous per-zone measurement during operations.
The real exposure workers experience is known.
Filters and extraction serviced by date.
Maintenance alerts from measured air and pressure.
Service when the data says so.
Ventilation raised blindly.
Outdoor conditions weighed before adding air.
Air improved without wasted fan energy.
What you get
Continuous PM2.5 and PM10
Per zone, through every shift.
Exposure tracking
How long levels stayed above target, not just the peak.
Source tracing
Spikes aligned with processes, schedules and outdoor air.
Maintenance triggers
Filter and extraction alerts routed to your CMMS.
Related standards
Check the current version and what applies to your site.
Where teams put it to work
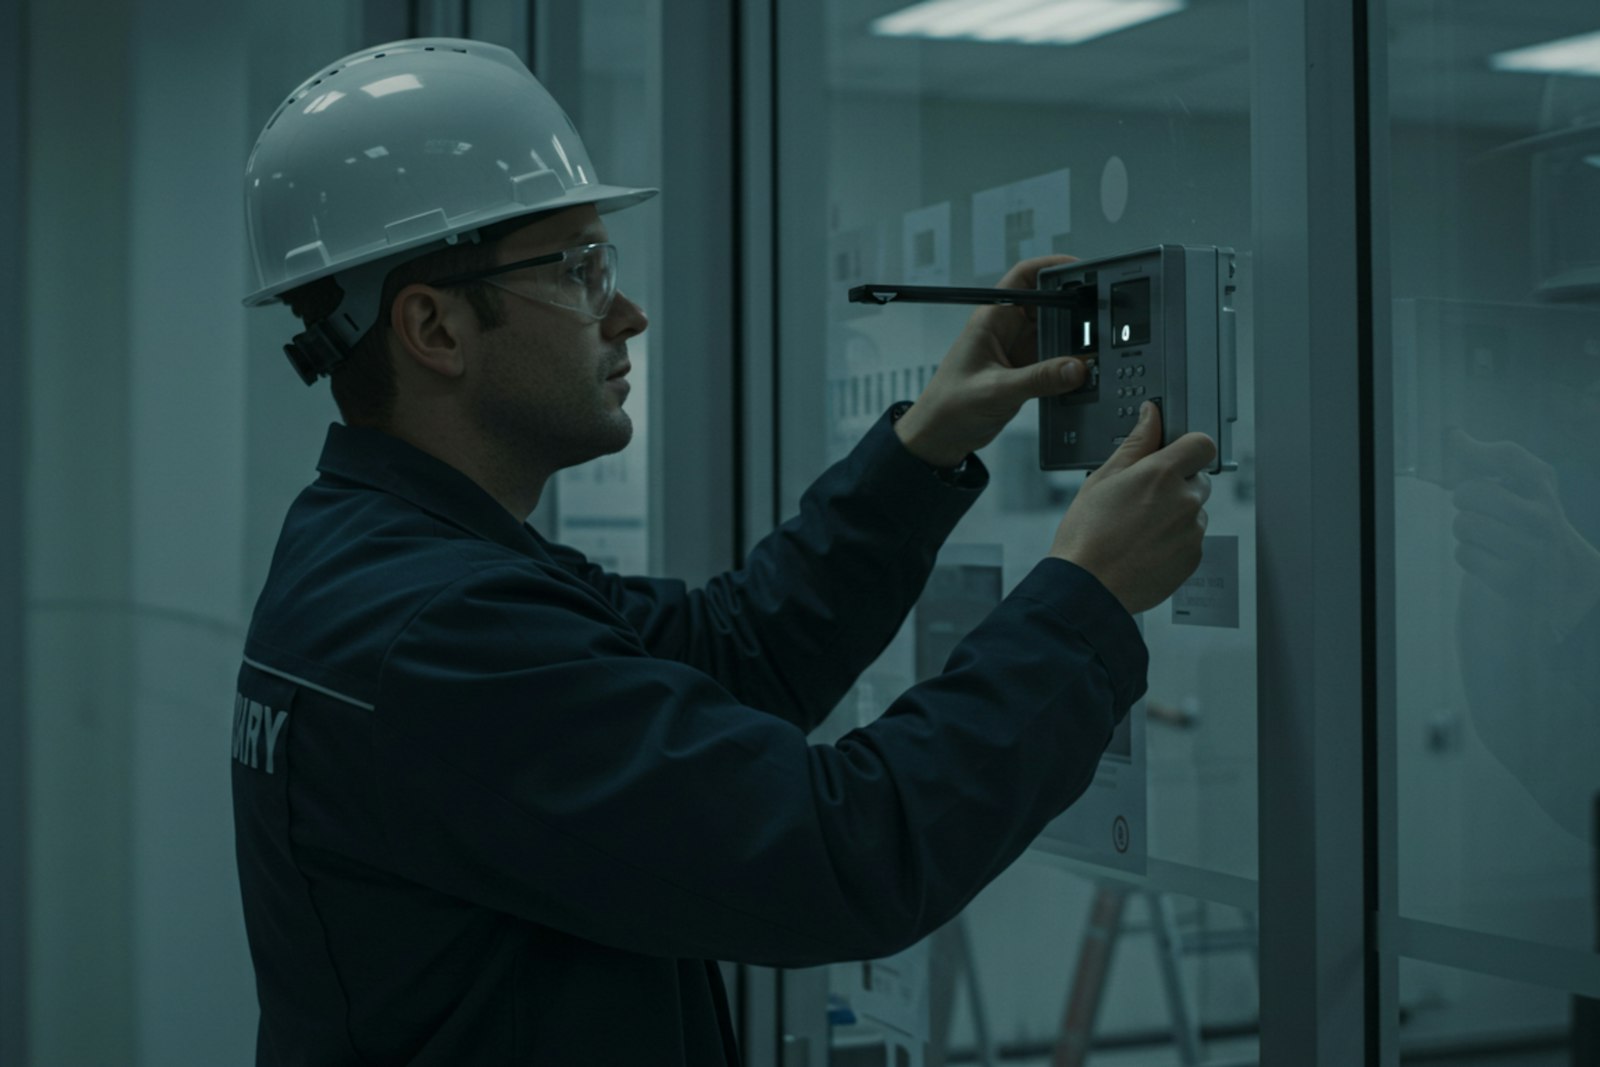
Particulates by production line
Sensors near each line show which process raises PM2.5 during a shift, so extraction work goes to the right station first.
Learn more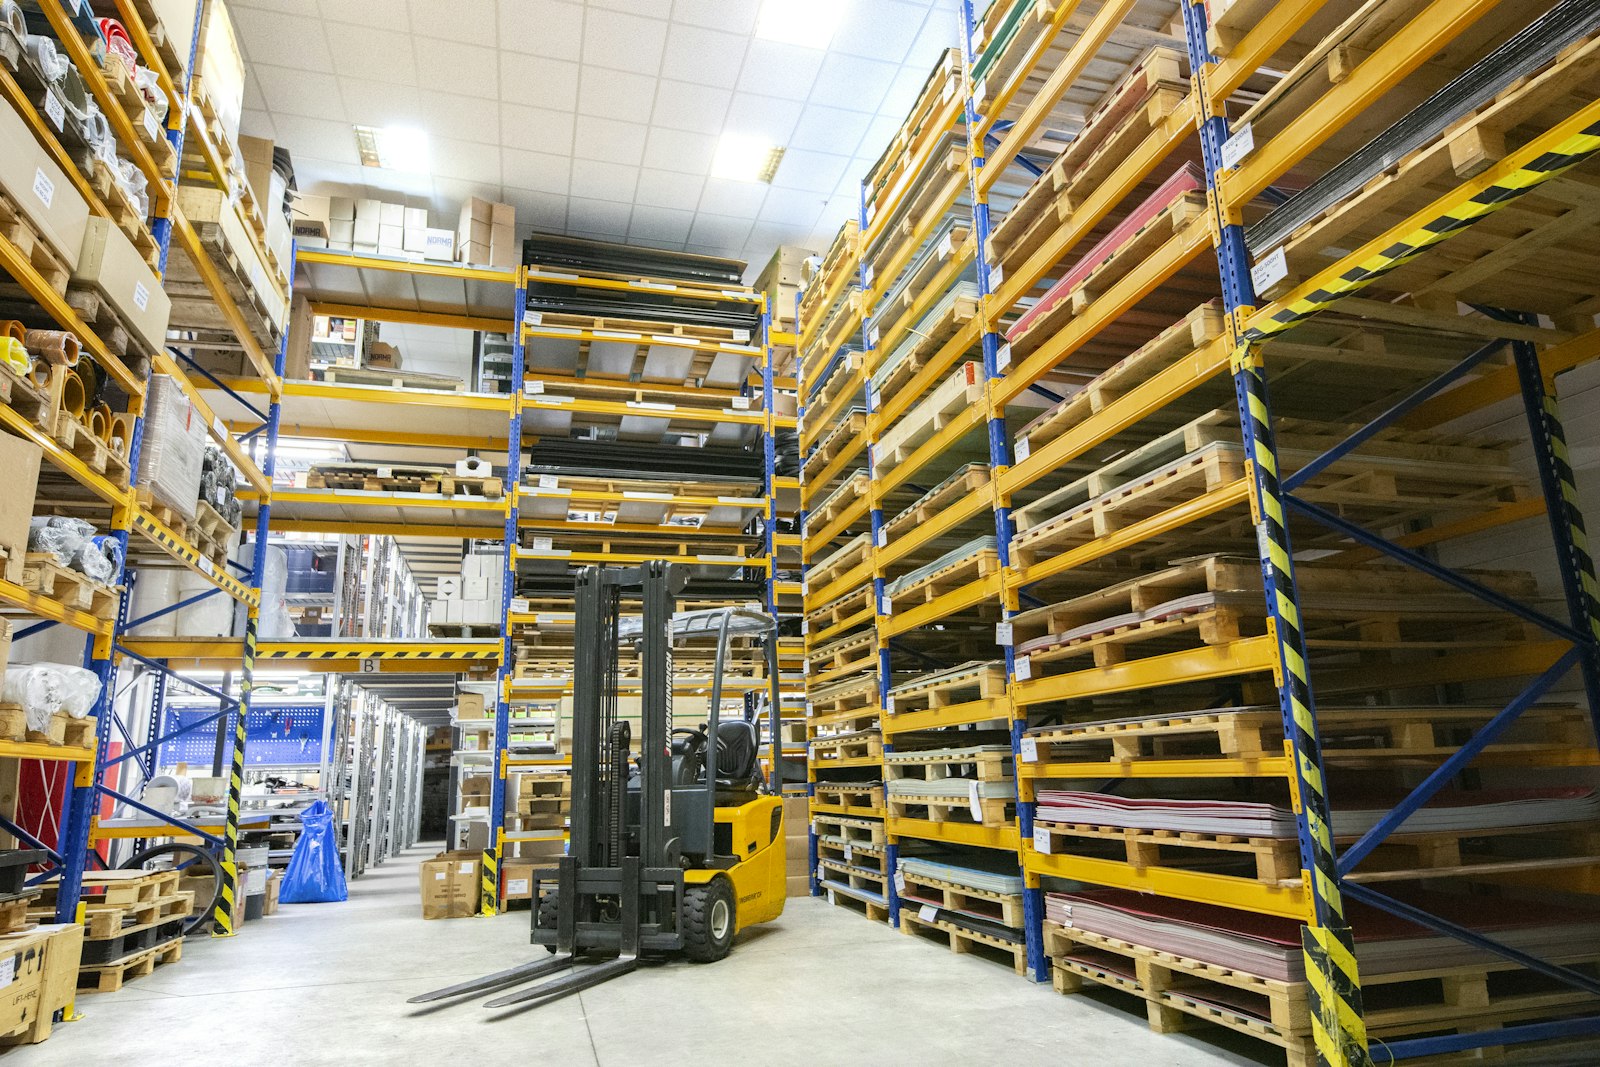
Dust from traffic and loading
Zones near docks and busy aisles are tracked through every shift, so dust from vehicles and handling is seen and addressed.
Learn more
Clean air in processing halls
Processing and packaging areas are monitored continuously, with filtration maintenance triggered by condition rather than a fixed date.
Learn moreRelated
Common questions
PM2.5 are fine particles small enough to reach deep into the lungs. PM10 includes coarser particles such as dust. Many sensors report both.
A single test reflects conditions on that day. Continuous monitoring shows the curve during real operations, which is what people breathe.
It aligns readings with zones, schedules, occupancy and outdoor conditions, which usually points to the process or event behind the spike.
Yes. Offices, schools and hospitals see particulates from outdoor air, construction and cleaning, and use the same zone view.
See Aqueduct on your own facility.
Bring a site, a utility bill or a question. We will show you where the loss is.