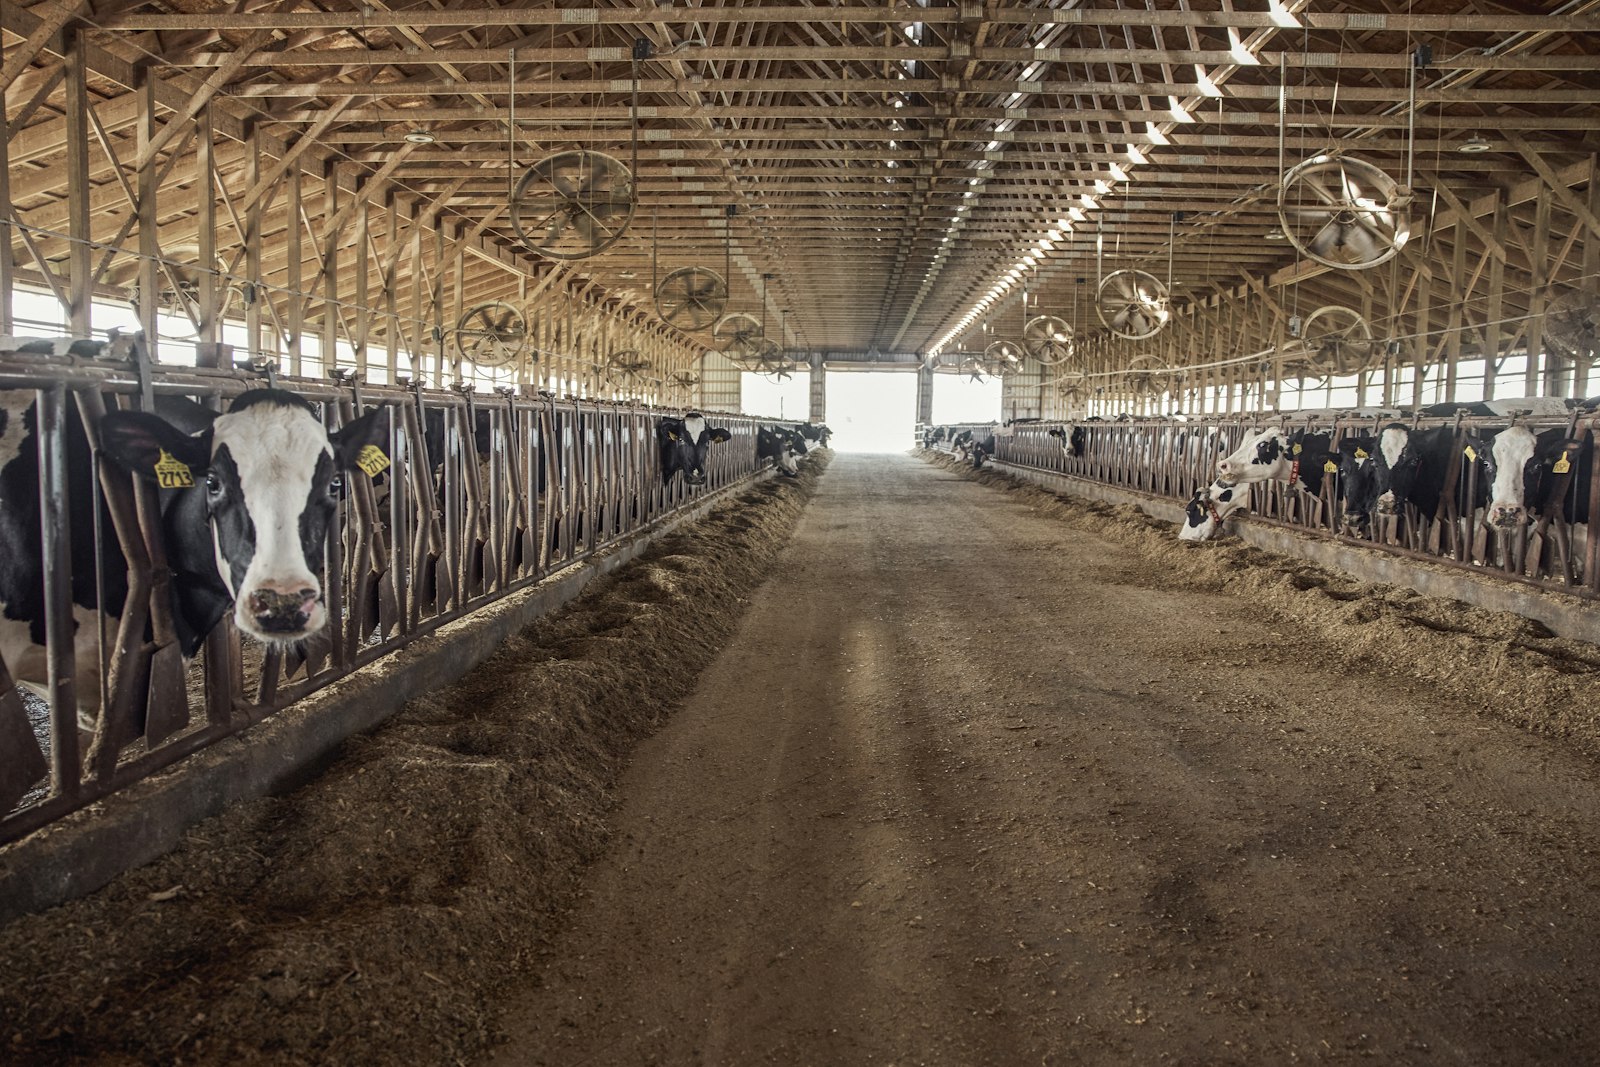
Major dairy operations run on Aqueduct. Verified at the meter.
Process water, clean-in-place, refrigeration and steam on one platform. Baselines per line and per asset, losses fixed, savings verified at the meter.
Measure process water, refrigeration and steam per line, and prove every saving.
Clean-in-place water measured cycle by cycle, line by line
- One balance per line
Process, clean-in-place and make-up water sit in one balance, so a loss has a line and a price.
- Cycles against baseline
Each clean-in-place cycle is compared with its own baseline, so a valve not seating shows up fast.
- Proven in dairy
Major dairy operations run on Aqueduct, with results verified at the meter.
Compressors and boilers baselined against production and weather
- Production-aware baselines
Refrigeration and steam use are modeled against production and weather, so real waste stands out from a busy week.
- Peak demand managed
Where control is enabled, with owner approval, loads are sequenced so compressors and pumps do not peak together.
- Savings in money
Rate configuration from your bills turns the difference from baseline into money on every line.
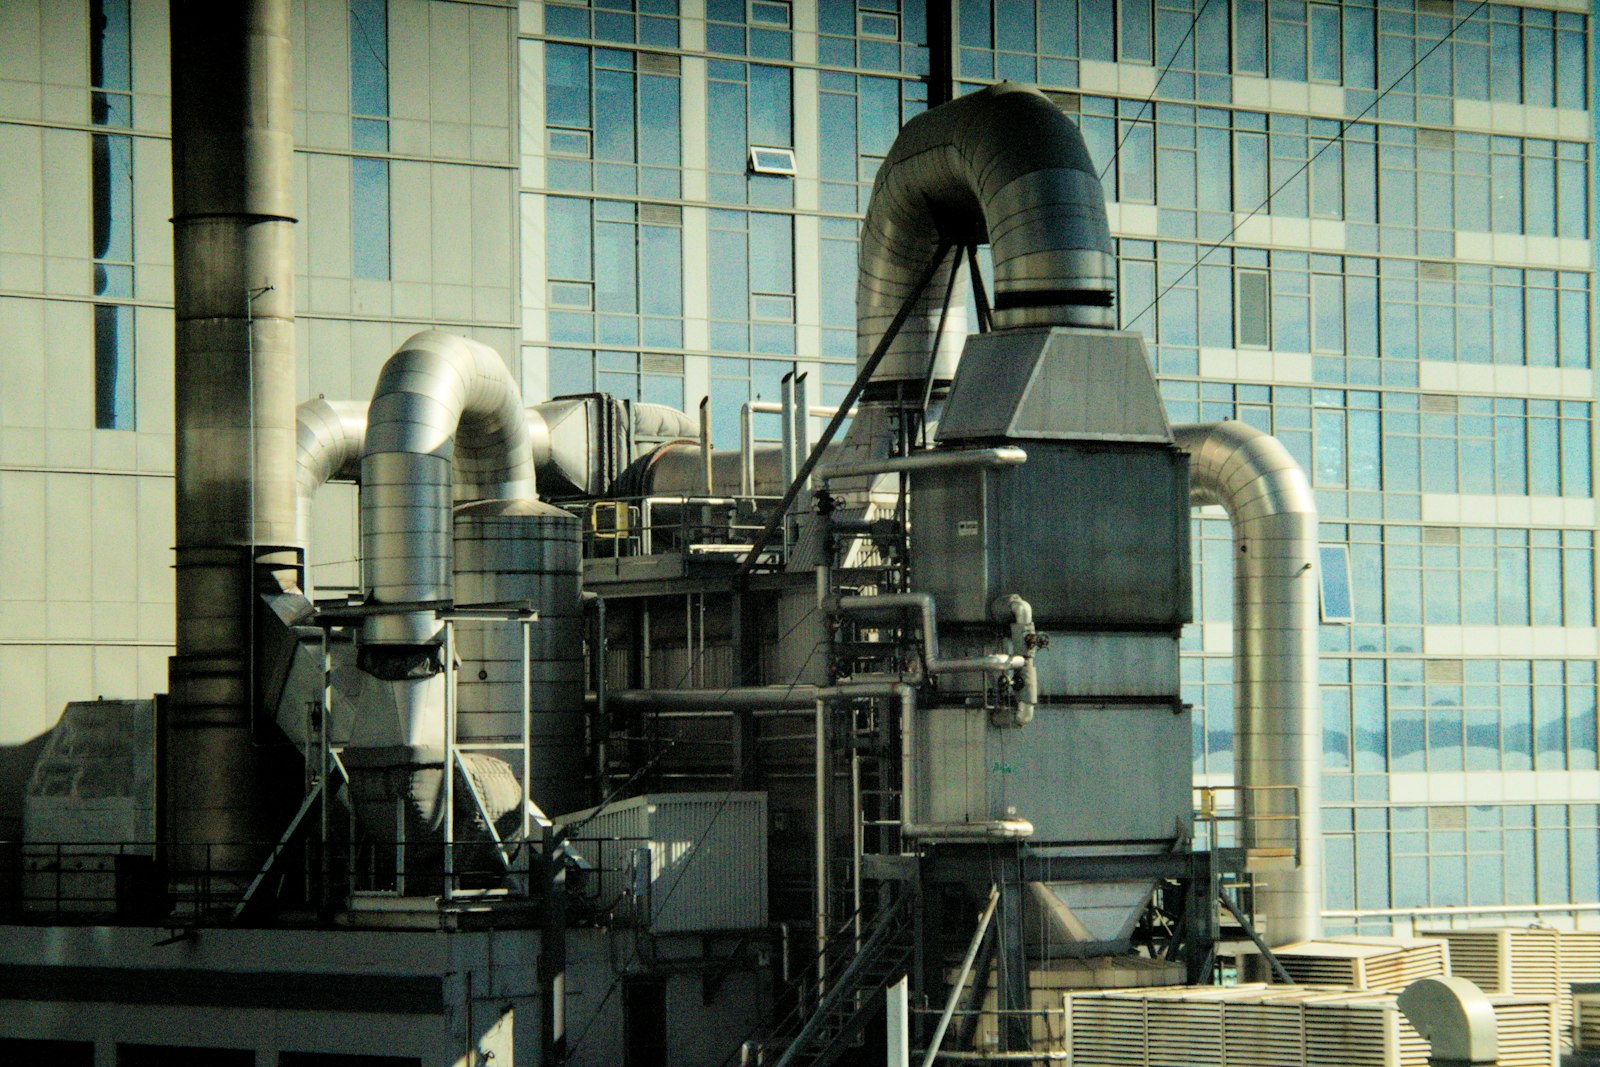
Compressors serviced before they fail on a milking day
- Early signs of failure
Rising vibration, a new sound signature and energy drift schedule maintenance before a compressor stops.
- Faults routed
Faults arrive diagnosed with the likely cause and the fix, routed into the CMMS your team uses.
- Safe rooms watched
Ammonia rooms and work areas are monitored against their limits, with alerts by zone.
Running a dairy unit, before and after Aqueduct
- The monthly bill is the only water reading anyone sees.
- Clean-in-place cycles use whatever water they use.
- A compressor fault is found when the milk tank warms.
- Refrigeration and pumps start together and set the peak.
- Savings are guessed from one bill to the next.
 The Aqueduct way
- Water is read per line, refreshed every 60 seconds.
- Each clean-in-place cycle is checked against its own baseline.
- Compressor vibration and drift schedule maintenance first.
- Loads are sequenced with owner approval, so peaks drop.
- Savings are verified at the meter against production and weather.
What dairy units and food processing teams are up against.
Water, energy, air and operations carry equal weight. Each one runs the same loop: monitor, measure, identify, act, verify.
Water: Clean-in-place water, measured per cycle
Process, CIP and make-up water in one balance, so loss has a line and a price.
Energy: Refrigeration and steam, baselined
Compressors and boilers against production and weather.
Air: Plant air and safe rooms
Ammonia rooms and work areas monitored against their limits.
Operations: Compressors that do not surprise you
Vibration and energy drift caught before the fault.
Problem, solution, impact.
How Aqueduct resolves each problem for dairy units and food processing, and what changes when it does.
Process, CIP and make-up water in one balance, so loss has a line and a price.
A live water balance across meters and sub-meters localizes the loss, routes the fix and confirms it closed at the meter.
Loss found from the balance, not the bill, and every fix verified.
Compressors and boilers against production and weather.
Weather-normalized baselines per building and asset show the waste in money; schedules and setpoints adjust where control is enabled.
Savings stated in money and confirmed at the meter, not estimated.
Ammonia rooms and work areas monitored against their limits.
Air quality per zone, overlaid with occupancy, with ventilation raised when it matters and verified back in range.
Targets held during occupied hours, with the energy cost counted.
Vibration and energy drift caught before the fault.
Faults diagnosed in plain language and routed into your CMMS with the fix; early signs of failure schedule maintenance first.
Fewer reactive call-outs and closures confirmed by the equipment.
One incident, from first signal to verified fix.
An illustrative example of the flywheel on a typical site.
Process and utility meters, compressor and boiler points, per line.
A baseline per line, shift and asset.
CIP cycle on Line 2 using 18% more water than its baseline.
Ticket routed with the cause: a valve not seating.
Cycle back to baseline. The saving shows on the bill.
Four connected products on one data layer.

Every liter and every kilowatt on a farm should have a line and a price.
Talk to our teamReplace what should be replaced. Connect the rest.
- Utility monitoring
- Energy management
- Water management
- CMMS
- Historians and plant SCADA, read only
- ERP for cost allocation
Three equal ways in: keep your BMS, replace it, or build Aqueduct in at design stage.
The questions each seat asks first.
“What does it take off the bill?”
“Does it work alongside plant SCADA?”
“Can I report water per litre of milk?”
Where teams put it to work
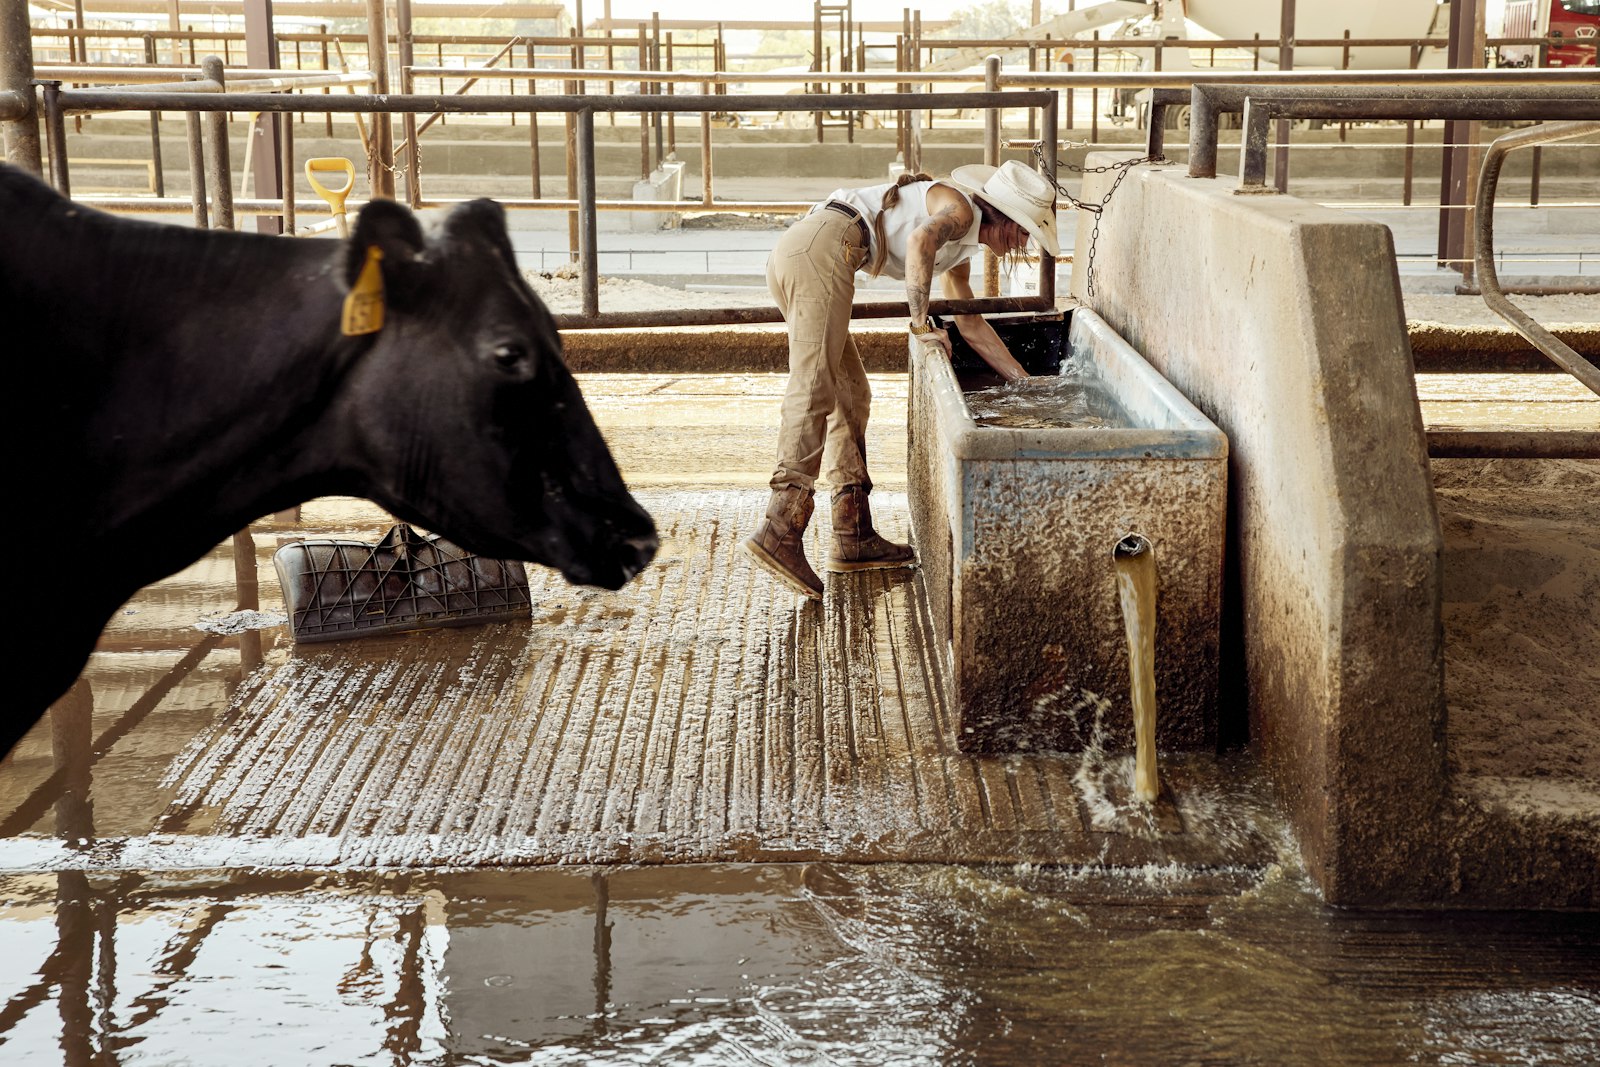
Water, power and steam on one platform
Process water, refrigeration and steam measured per line, losses fixed, and savings verified at the meter. Major dairy operations run on Aqueduct.
Learn more
Utilities measured per production line
Clean-in-place, cooling and steam baselined against production, so a line that drifts is found the same day, not at month end.
Learn more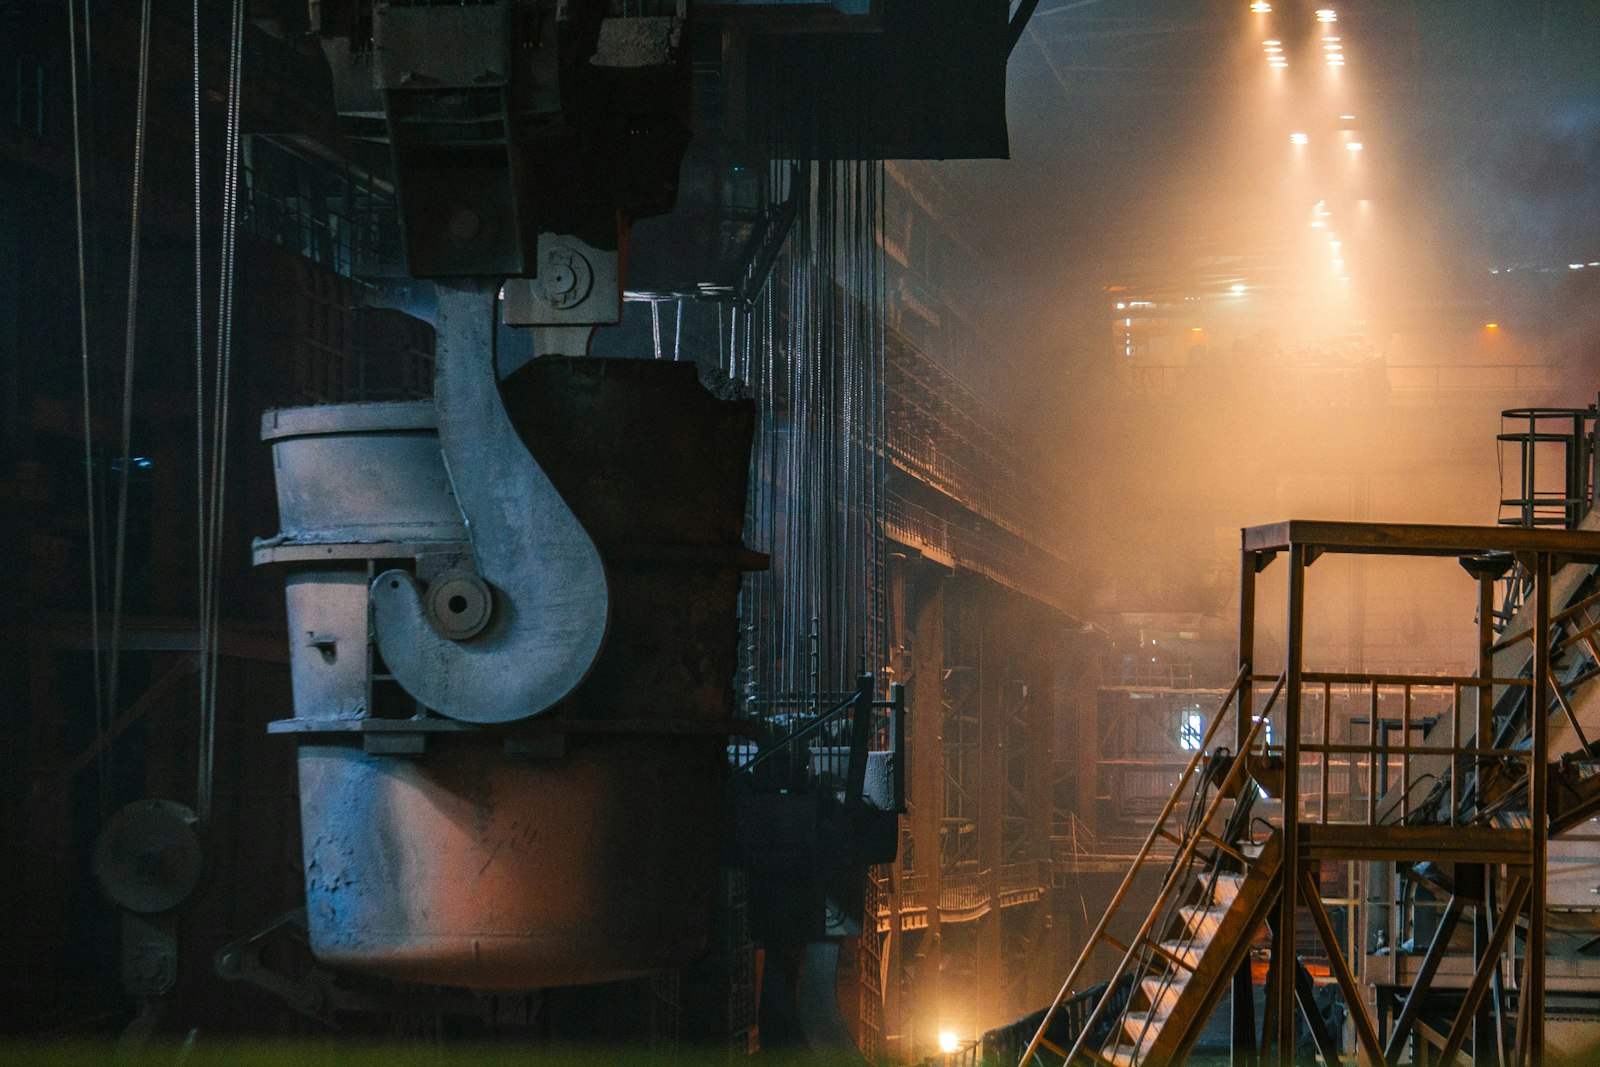
Planned work instead of breakdowns
Vibration, sound signature and energy drift on compressors and pumps schedule maintenance first, so failures stop reaching the milking parlor.
Learn moreEvery part of a dairy, from farm to effluent
Four guides to the utilities a dairy runs on, each measured, acted on and verified on one platform.
Refrigeration and cold chain
Ammonia plants, chillers, ice banks and cold rooms, with kW per TR and COP measured per refrigeration group.
Learn moreCIP and process water
Water, chemical and heat per clean, inside a live process water balance with measured reuse.
Learn moreEffluent and ETP
Inflow load traced to its source, treatment measured hour by hour and discharge kept on record.
Learn moreDairy farms
Milking parlors, bulk milk coolers, barn ventilation and water troughs on one farm view.
Learn moreDairy utilities and what Aqueduct measures first
A starting point for most dairies. The site survey replaces it with your plant's own priorities.
| Utility | What Aqueduct measures first | Guide |
|---|---|---|
| Refrigeration | Compressor power against cooling delivered, discharge pressure, condenser water flow | Refrigeration and cold chain |
| Process water and CIP | Water per CIP cycle and step, source to discharge balance, recovery tank overflow | CIP and process water |
| Effluent | ETP inflow load, aeration energy, treated discharge and reuse | Effluent and ETP |
| Steam and boilers | Fuel per tonne of steam, condensate return, blowdown | Compressed air and steam |
| Farm utilities | Bulk tank pull down, parlor wash water, trough flow, barn fans | Dairy farms |
A major dairy operation runs water, electricity and refrigeration on Aqueduct
Major dairy operations run on Aqueduct. One dairy scope spans 5 refrigeration plants, 21 compressors and 2,080 TR of installed capacity.
Read the dairy case study
Water, electricity from 41 SCADA sources and refrigeration on one platform, with the engineer approving every response.
Learn moreDairy inside an FMCG campus
Dairy and ghee is one of 8 business units on a 300-acre FMCG manufacturing campus scoped on Aqueduct.
Learn moreHVAC&R for food and pharma
Chillers, compressors and cold rooms measured, diagnosed and run to their load.
Learn moreNine utilities run through a dairy. Most plants meter one.
A dairy is a reception bay, a chilling hall, pasteurizers, separators, evaporators, a CIP skid that never stops, a boiler house, a refrigeration plant, an effluent plant and a collection network that reaches far outside the fence. Each one uses a different utility on a different rhythm. Click a system to see where the loss hides and what Aqueduct measures.
Process and service water
Intake is metered at the boundary only. Leaks, overflowing tanks, idle draw and hoses left running in wash-down areas all disappear into one monthly number.
Clamp-on ultrasonic flow at the intake, per unit and per line, plus tank levels.
aQ WaterGuard builds a balance that has to close: supply equals process plus CIP plus RO feed plus utilities plus loss. When it stops closing, the loss term rises and someone is told.
Clean-in-place and wash-down
Rinse, caustic, acid and final rinse run to a fixed recipe and a fixed timer, not to a measured endpoint. Over-cleaning never shows up as an error.
Flow and conductivity per CIP circuit, litres and minutes per phase, cycle by cycle.
Every cycle is compared with the previous comparable cycle on the same circuit, so a passing valve, an extra rinse or a skipped recovery step stands out the same day.
Refrigeration and chilled water
Fouled condensers, wrong suction pressure, iced evaporators and open doors raise the cost of cold without tripping an alarm, because the product stays cold.
Compressor power, suction and discharge pressure, run hours, chilled water temperatures, kW per ton of refrigeration.
aQ EnergySmart trends efficiency against load and ambient, so a drifting compressor bank shows up as a widening gap to its own baseline.
Boiler, steam and condensate
Failed traps, unreturned condensate and unmanaged blowdown. Each lost kilogram of condensate is paid for in fuel, treated make-up water and chemicals.
Fuel input, steam flow, condensate return ratio, feedwater make-up, blowdown.
The thermal side is closed as its own balance. Condensate return ratio becomes the headline number the boiler house is run to.
Electrical distribution
Power factor penalties and demand peaks are found on the invoice, weeks after the shift that caused them.
Feeder and panel load, power factor, peak demand, harmonics, transformer loading.
Peaks are visible while they build, and each one is tied to the line or asset that drove it.
Compressed air
Leaks at valves, actuators and fittings run all day and all night. Nothing on the floor reports them.
Compressor kW, flow and pressure, with off-shift demand as the leak signature.
Off-shift baseline demand is trended per ring main, so leak load is a number with a trend, not a guess.
RO and water treatment
Reject goes to drain instead of to a reuse point. Membrane fouling raises energy and lowers recovery slowly.
Feed, permeate and reject flow, recovery rate, differential pressure.
Recovery is tracked per train and reject is routed into the plant balance as a recoverable stream, not a write-off.
Effluent, ETP and ZLD
Shock loads from a CIP dump or a ghee line wash arrive at the ETP without warning and can upset a biological stage for days.
Inflow and discharge, reuse volume, load profile, events by source.
aQ Core ties each effluent spike to the wash, dump or line that caused it, so heavy discharges can be staggered instead of stacked.
Chilling centers and bulk coolers
Remote sites on unreliable power with no telemetry. A failing compressor or a door seal is discovered as a rejected tanker.
Compressor power, run hours, milk temperature profile, lid or door events, supply availability.
Every center is a site in the same portfolio as the plant, ranked on cooling performance, over cellular or LoRaWAN with local buffering.
Where a dairy's water and energy actually go
of water used per liter of milk processed, depending on product mix and practice
Source: Water quality and resource management in the dairy industry, National Library of Medicineof dairy plant water goes to clean-in-place
Source: Towards sustainable Cleaning in Place in dairy processing, Comprehensive Reviews in Food Science and Food Safetyof dairy processing electricity is used by refrigeration
Source: Energy requirements in milk processing, FAOof a dairy's total energy goes to steam and hot water
Source: Energy requirements in milk processing, FAOSix places a dairy spends money without seeing it
Processing plants and the farms that supply them have different problems. The plant fights cleaning, cold and heat. The farm fights one failure that matters more than any bill: milk that cannot be sold.
Clean-in-place, measured per cycle
CIP is the largest controllable water volume in the plant and one of the largest energy users, because caustic and acid circulate hot. Almost every cycle runs to a timer. Measurement is what makes it safe to reduce, because it shows where the endpoint is reached early and where it is not.
- Final rinse recovered as the next pre-rinse, with the saving measured
- Cycles on vessels that were not used, found and stopped
- Passing valves and sequencing overlap visible as extra litres per cycle
- Measured
- flow, conductivity, temperature, duration per phase
- Target
- your validated recipe, cycle by cycle
- Aqueduct
- compares each cycle with its last comparable cycle and flags drift
Ammonia or glycol plant, held to its own baseline
Refrigeration is the largest electrical load in a processing plant. It degrades quietly: condensing pressure creeps up, an evaporator ices, a door is propped open. Product stays cold, so nothing alarms. The cost shows up only as a higher bill.
- kW per ton of refrigeration tracked, not just total kWh
- Condensing and suction pressure trended against ambient
- Short-cycling and defrost faults flagged before they become downtime
- Measured
- compressor power, pressures, run hours, chilled water temperatures
- Target
- the plant's own weather-normalized baseline
- Aqueduct
- aQ EnergySmart ranks the compressors drifting furthest from baseline
The boiler house as one thermal balance
Pasteurization, sterilization, evaporation, drying and CIP heating all run on steam and hot water. Without a preventive program, failed traps can lose around a fifth of the steam leaving the boiler. Unreturned condensate is paid for three times.
- Fuel in, steam out, condensate back and blowdown reconciled together
- Condensate return ratio as a daily number with an owner
- Trap failures inferred from rising make-up against steady demand
- Measured
- fuel, steam flow, condensate return, feedwater make-up, blowdown
- Target
- return ratio and steam per liter set by the plant
- Aqueduct
- closes the thermal loop and names the gap
Chilling centers you never visit
Bulk milk coolers and village chilling centers sit on unreliable grid power with nobody watching. A cooler losing performance still cools, just slower and less far. The first sign is often a rejected tanker hours after collection.
- Continuous milk temperature, not a reading at pickup
- Compressor run hours and power so slow decline shows as a trend
- Power outages logged, so an excursion has an explanation
- Measured
- milk temperature, compressor power, run hours, lid events, supply
- Target
- your collection temperature standard
- Aqueduct
- alerts while the milk is still recoverable and a field engineer can still go
Plate cooler, water heating and vacuum
On the farm three loads dominate: milk cooling, water heating for parlour cleaning and the vacuum pump. The plate cooler sits upstream of refrigeration and decides how hard it works. When its water flow or temperature drifts, the bulk tank quietly takes the extra load.
- Plate cooler water flow and milk temperature in and out
- Water heating run time against tariff periods
- Vacuum pump demand, so a variable speed case rests on measured load
- Measured
- power per load, water flow and temperature, vacuum level
- Target
- energy per liter collected, compared farm to farm
- Aqueduct
- one standard kit per parlour, ranked across the network
An effluent plant that is managed, not judged
Dairy effluent is strong, and ghee and butter lines carry the heaviest fat load. CPCB general standards set outlet BOD at or below 30 mg per liter for inland surface discharge. A plant under a zero liquid discharge condition has to show where every liter went.
- Effluent events tied to the wash or dump that caused them
- Reuse from STP, RO reject and condensate measured, not estimated
- Discharge trend alerts before a consent boundary is reached
- Measured
- inflow, discharge, reuse volume, load profile
- Target
- your consent or ZLD condition
- Aqueduct
- supplies the measured balance; the board and your auditor judge it
Same plant, three different clocks
The physics of a dairy does not change between Wisconsin, Dubai and Andhra Pradesh. What changes is what water and cooling cost, and who is asking for proof. Orientation only, not legal advice.
| Market | Pressure on the plant | Evidence it asks for | What Aqueduct supplies |
|---|---|---|---|
| United States | Rising water and sewer costs, and a sector commitment to greenhouse gas neutrality by 2050 under the US Dairy Stewardship Commitment | Self-reported progress the processor has to stand behind, and plant scoring against the ENERGY STAR fluid milk and yogurt indicator | Sub-metered intensity per plant, per liter and per shift |
| Dubai and the UAE | Desalinated water and a cooling-dominated grid, with a 30% demand reduction target for electricity and water by 2030 | Consumption per asset rather than an estimate, under Al Sa'fat and the Demand Side Management strategy | Measured refrigeration and HVAC load against ambient, asset by asset |
| India | BRSR Core assurance on water and energy intensity, pollution board enforcement, and the Carbon Credit Trading Scheme | Numbers an independent assurer can trace to source, and continuous discharge records | Timestamped, line-level records for BRSR, CPCB returns and ZLD balances |
| Supply chain | Processors and retailers pushing disclosure requests down to the farms that supply them | Farm-level energy, water and effluent data, attributable per site | One portfolio across plant, chilling centers and farms |
One plant first, then the collection network
Start with one self-contained, high-intensity unit with a full water and thermal story. Prove it against your own bills. Then turn the farm and chilling center setup into a standard kit.
Plant walk and bill review
Map water points, CIP skids, RO and STP loops, boilers, condensate return, panels and compressors. Check gateway coverage. Pull 12 months of utility bills so the baseline can start on day one.
Instrumentation plan
Sensor list, gateway layout and the water and thermal balance model, signed off by your utilities engineer before anything is fitted. Existing meters, PLCs and historians are read first.
Phased metering during production
Clamp-on flow, pressure, level and power sensors go in while lines run. Anything that needs a line break waits for a planned shutdown. Each zone comes online as it is finished.
Balance closed, first losses named
The water and thermal balances reconcile. The first losses are named in liters, kWh and money against a weather-normalized baseline. This is the before and after that unlocks the next unit.
Chilling centers and farms as a kit
Parlours and chilling centers repeat, so the sensing becomes a standard package over cellular or LoRaWAN. Each site joins the same portfolio, ranked on cooling performance and energy per liter.
One measured plant, four different answers
Plant head
Leaks, over-cleaning, idle draw and power factor penalties as named line items with an owner and a payback.
Learn moreUtilities engineer
kW per ton, condensate return and CIP liters per cycle as live numbers, read alongside SCADA, never in its place.
Learn moreSustainability and EHS
Water per liter of milk, reuse by stream and discharge records ready for BRSR, GRI 303 and CDP Water.
Learn moreMilk procurement
Every chilling center and bulk cooler ranked, so field engineers go where the next rejection is coming from.
Learn moreSources16 references cited on this page
- Water quality and resource management in the dairy industry, National Library of Medicine
- Remove the weight of water use in dairy plants, Dairy Foods
- Towards sustainable Cleaning in Place in dairy processing, Comprehensive Reviews in Food Science and Food Safety
- Energy requirements in milk processing, FAO
- Fluid Milk and Yogurt Processing energy performance indicator, ENERGY STAR
- Best practices: steam and condensate leaks, Plant Engineering
- Compressed air system leaks fact sheet, Compressed Air Challenge
- CPCB guidelines for effluent treatment plants in the dairy industry, Netsol Water
- Boiler feedwater and reverse osmosis for modern steam systems, Kurita America
- Sustainability and the US Dairy Stewardship Commitment, IDFA
- Dubai Demand Side Management Strategy, Dubai Supreme Council of Energy
- Al Sa'fat Dubai Green Building System, Dubai Municipality
- India Carbon Credit Trading Scheme guide, rSustain
- Milk production in India, National Dairy Development Board
- Water use on dairy farms, MSU Extension
- Water usage on dairy farms, Ohio State University
Proven in live sites.
Anonymized results, verified at the meter.
operations on Aqueduct, with energy savings verified at the meter
Features that matter here
Common questions
Major dairy operations run on Aqueduct. Energy and water savings are verified at the meter against a weather-normalized baseline.
No. Aqueduct reads plant data alongside SCADA and historians. Process control stays where it is.
Existing meters and points first. New sensing only where the plant is blind.
Published benchmarks run from about 1 liter to more than 7, and product mix drives most of the spread: cheese and powder use far more than liquid milk. Your real number is unknowable until the intake and the major sub-loops are metered and unaccounted loss is separated out. Aqueduct gives you that number per line and per shift.
Yes, if you start with the reductions that do not touch validated steps: recovering final rinse as pre-rinse, stopping cycles on vessels that were not used, and fixing passing valves. Recipe changes should follow measured evidence that the endpoint is reached earlier, and go through your existing quality process. Monitoring stays in place afterwards.
No. Centers and bulk coolers connect over cellular or LoRaWAN with local buffering, so a coverage gap delays data instead of losing it. Coverage is checked during the survey. Nothing on site needs an IT function.
The one with the most complete utility story under one roof: heavy process water, CIP, a thermal load and its own electrical feed. Liquid milk or ghee usually beats dry milling. One supply, one discharge and one energy feed make the first balance clean.
Aqueduct supplies continuous, timestamped, metered records that an assurer can trace to the meter. It does not certify anything. Your assurance provider judges the disclosure, and it is easier to judge when the numbers are measured rather than reconstructed.
Energy savings on cooling, water heating and vacuum are real, but the case usually rests on avoided rejections. A rejected collection loses a day of that farm's milk plus the energy already spent cooling it. Catching a failing cooler while the milk is still recoverable is the point.
See Aqueduct on your own facility.
Bring a site, a utility bill or a question. We will show you where the loss is.