How to reduce facility operating costs, with results verified at the meter
Reducing facility operating costs means finding where water, energy and equipment time are wasted and proving each fix. Aqueduct does this across a portfolio: it connects existing systems, ranks sites against a weather-normalized baseline, routes fixes and acts where control is enabled with owner approval. Every saving is verified at the meter against a weather-normalized baseline.


Facility costs move when every fix is measured, owned and verified.
One view of every site, in money as well as units
- Against baseline
Every site measured against what weather and history say it should use.
- In money
Rate configuration from your own bills turns the gap into cost leadership recognizes.
- Across resources
Water, energy and air carry equal weight on one data layer, aQ Core.

Findings become fixes without new headcount
- Routed to your CMMS
Site teams receive located, explained findings in the CMMS and work systems they already use.
- Control where enabled
Schedules and setpoints adjust where control is enabled, with owner approval and every command logged.
- Capital ranked
Retrofit requests ordered by measured gap rather than by the loudest site.
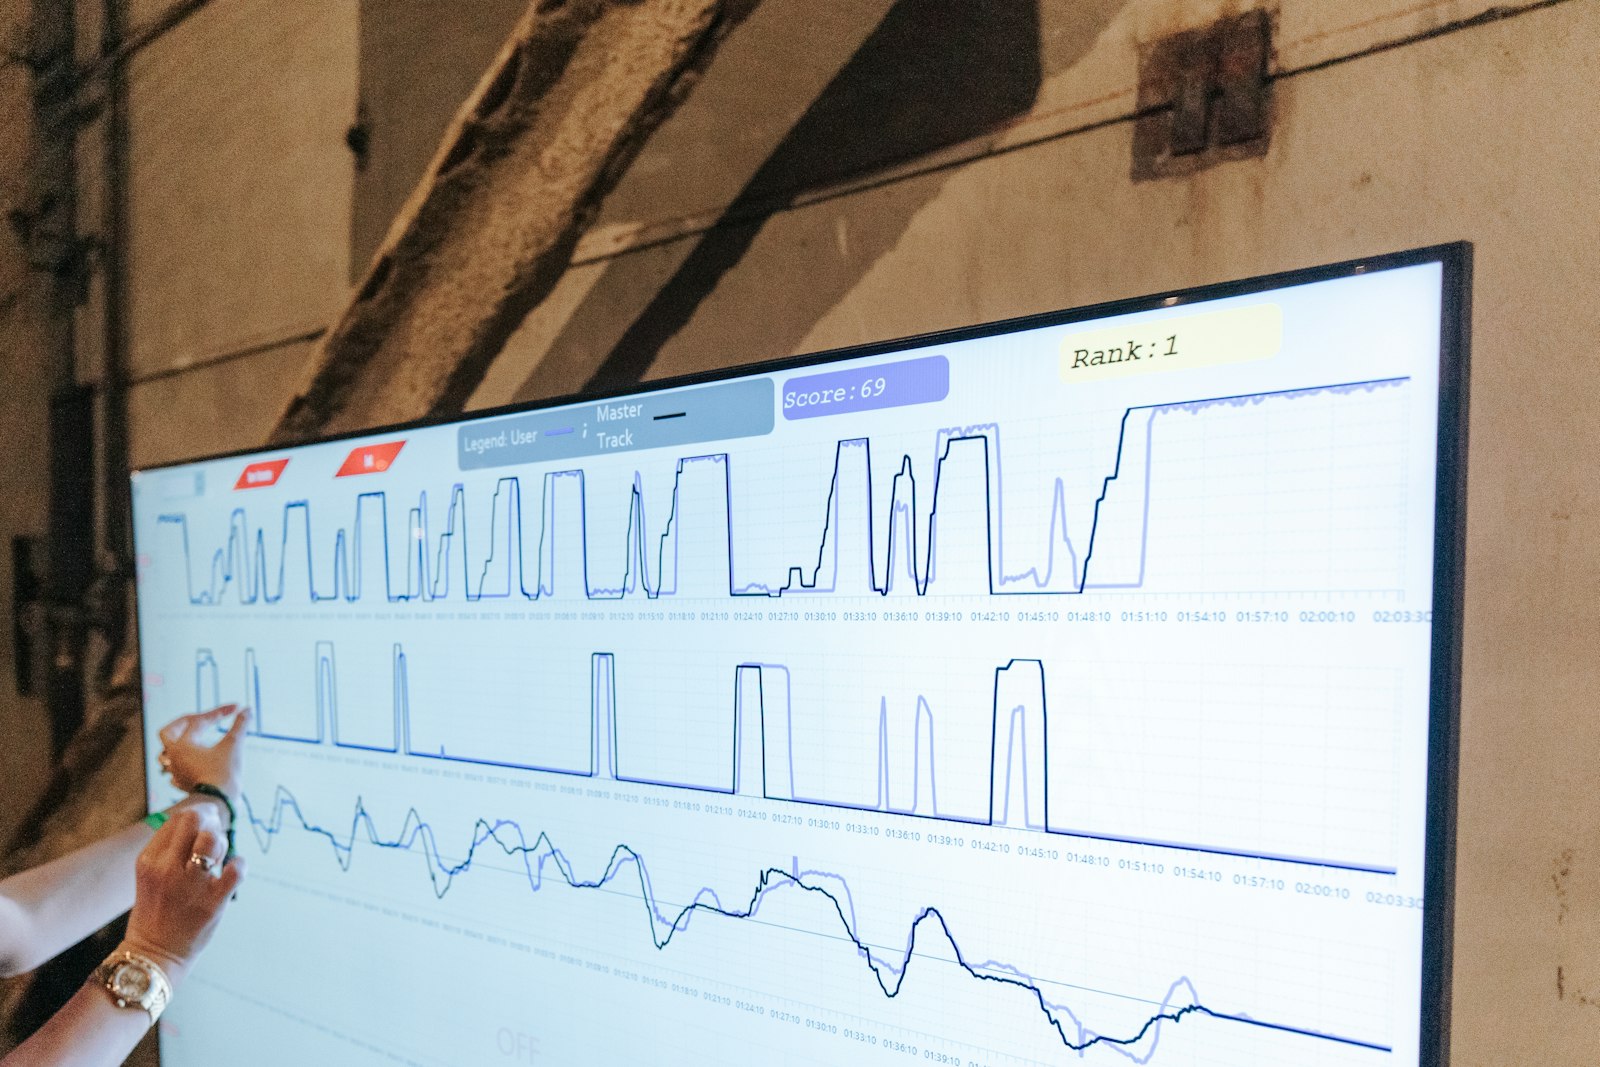
Results that survive a board question
- Verified at the meter
Savings are confirmed after the fix, never taken from a proposal or a projection.
- Approved proof
Energy and water savings verified at the meter against a weather-normalized baseline.
- Evidence for commitments
Metered, traceable data supports the sustainability reports that your own team or consultants prepare and file.

Facility costs, before and after Aqueduct
- Facility waste reaches leadership as a quarterly variance.
- Savings programs report figures nobody can reconcile.
- Each resource has a vendor, none owns the outcome.
- Capital goes to whoever asks loudest.
- Public sustainability commitments rest on estimates and invoices.
 The Aqueduct way
- Waste surfaces site by site against a live baseline.
- Savings reconcile to the meter and the bill.
- One platform owns water, energy and air outcomes.
- Capital is ranked by measured gap.
- Commitments rest on metered, traceable data.
Why facility costs are hard to move from the top
Executives see the totals. The causes sit in hundreds of meters, systems and work orders.
Costs seen only in arrears
Utility and maintenance spend reaches leadership as a quarterly variance, long after the waste happened.
Savings nobody can prove
Programs report savings from proposals, and finance cannot reconcile them to the bills.
Too many vendors, no owner
Water, energy, air and maintenance each have a system and a vendor, but nobody owns the outcome across them.
Commitments without evidence
Public sustainability and healthy building commitments need measured data the business does not yet have.
What leadership gets from Aqueduct
Outcomes stated plainly, measured at the meter, across every site.
Action, not just reports
Fixes routed to your CMMS, control where enabled with owner approval.
Learn moreQuestions executives ask
“What results do customers actually see?”
Savings are verified at the meter against a weather-normalized baseline, not estimated. Aqueduct is deployed in 275+ sites across 21 countries.
“Is this a sensor company or a software company?”
A product company. Milvian AI does not sell hardware as its core business; Aqueduct is device agnostic and installation runs through partners.
“How do we know the savings are real?”
Every saving is verified at the meter against a baseline that accounts for weather, and each verified result becomes the new baseline.
“Where does this lead over time?”
Toward autonomous facilities: buildings that know what is happening, act where control is enabled with owner approval, and verify the result.

Autonomous facilities start with knowing, acting and verifying every day.
Talk to our teamHow Aqueduct shows up in an executive's quarter
An illustrative quarter across a multi-site business.
Monthly review
Portfolio performance against baseline shows which sites improved and which slipped, in money as well as units.
Capital decisions
Retrofit and maintenance requests are ranked by measured gap rather than by who asks loudest.
Board reporting
Verified savings and metered sustainability data go into board and investor materials, prepared by your team.
Industries and outcomes leaders read first
Where Aqueduct runs today.
Where teams put it to work
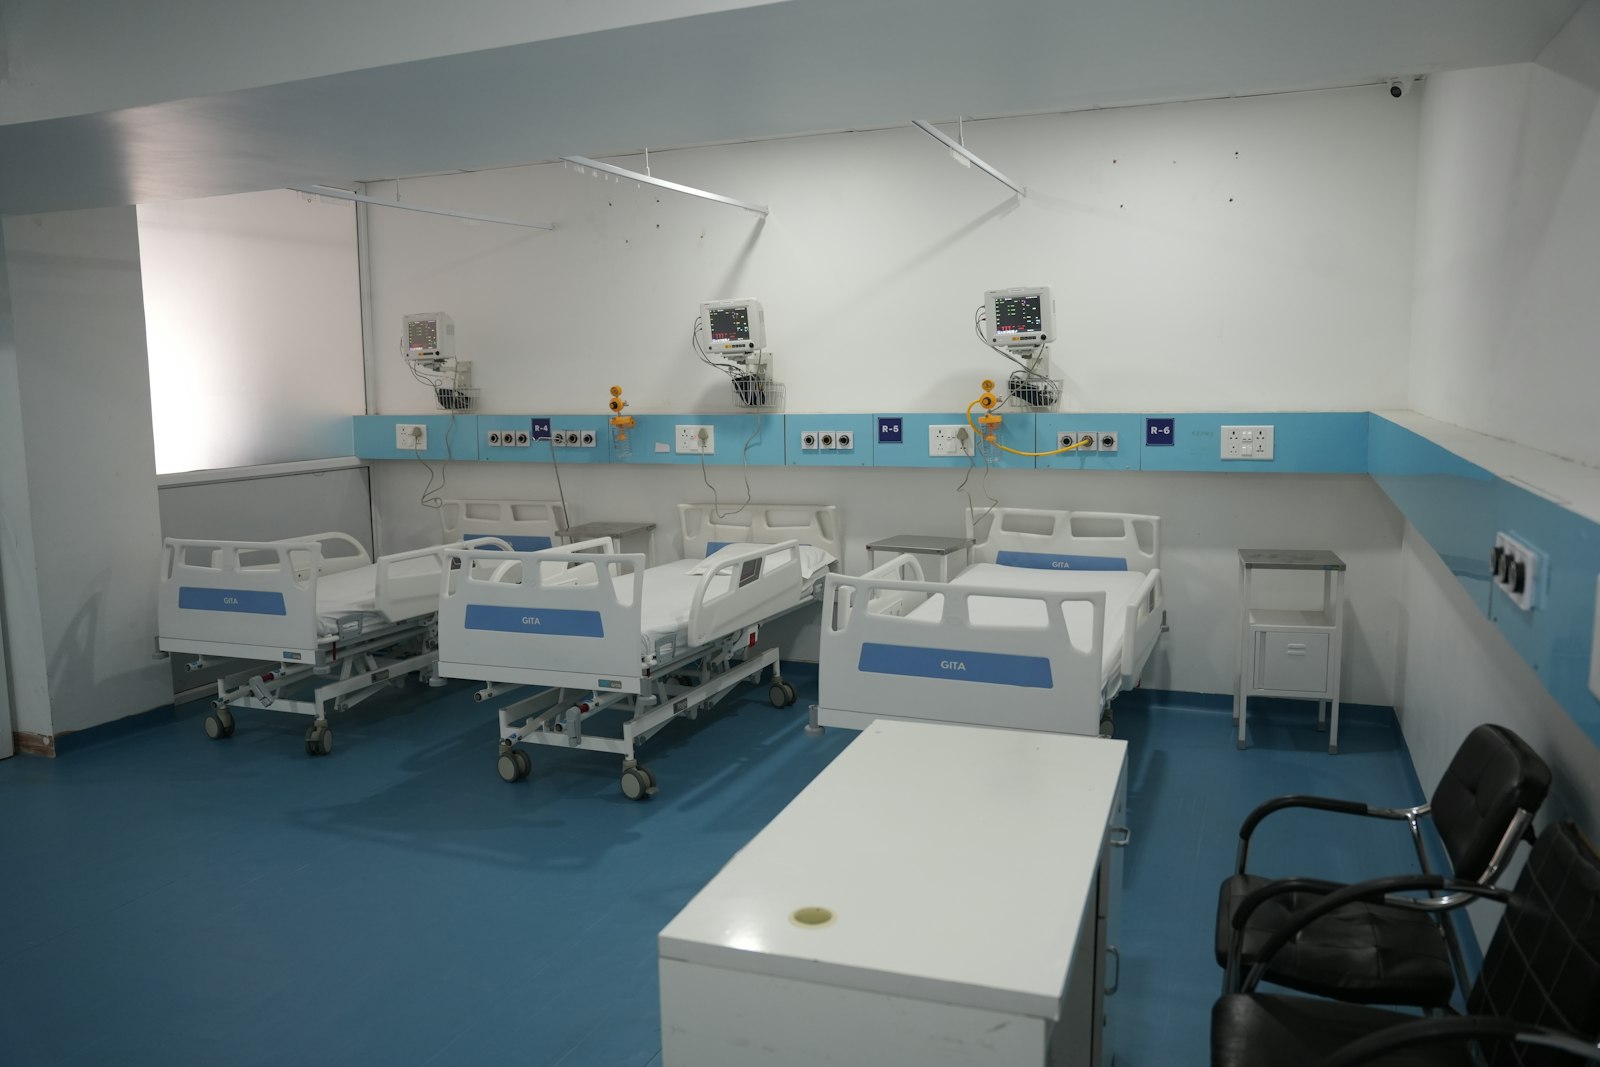
Hospitals and clinics on one platform
A hospital chain with 22 hospitals and 9 clinics is a client, measuring water, energy and air across sites on one data layer.
Learn more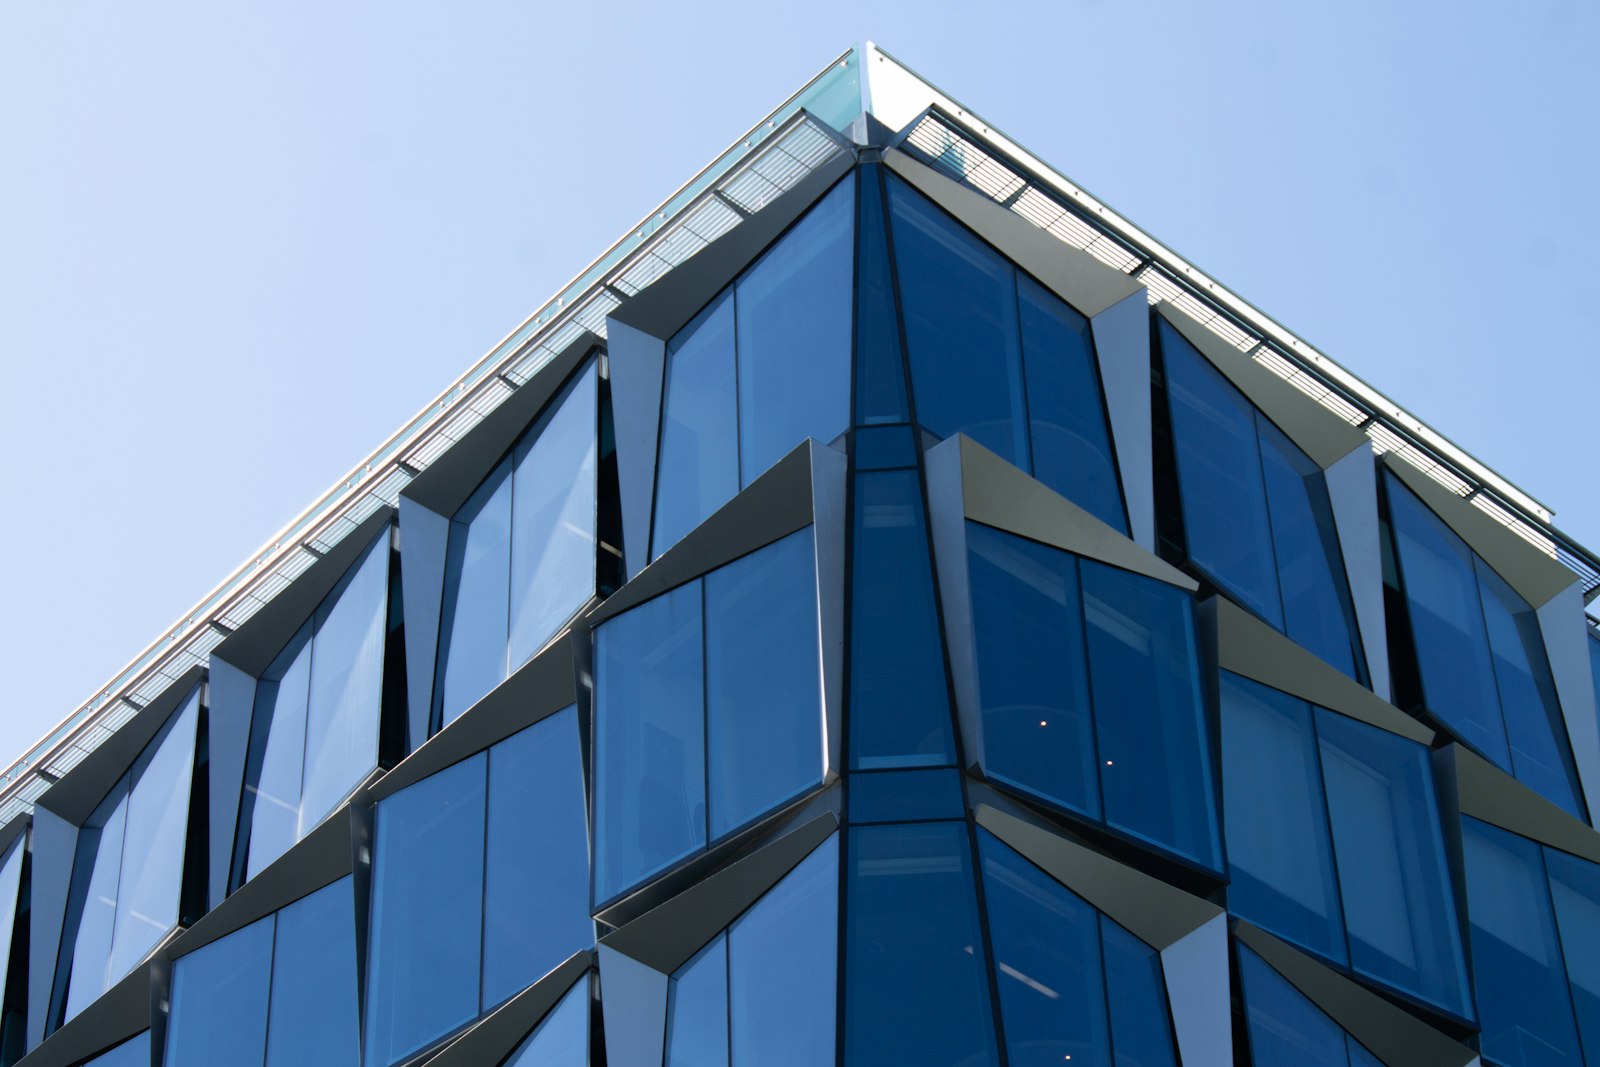
A large portfolio ranked by gap
A commercial real estate client with a 20M+ sq ft portfolio uses Aqueduct to decide which buildings get attention first.
Learn more
Process loss seen at the line
Major dairy operations run on Aqueduct, with process water, refrigeration and power measured at the line where the loss actually happens.
Learn moreFive facility decisions that land on the CEO's desk
Leadership rarely reads a meter. It does decide where money, risk and public commitments go. Here is what each decision needs from the facility layer, and what Aqueduct puts behind it.
Which sites get retrofit money this year
Capital requests arrive as proposals with projected savings. The honest question is which site has the largest measured gap against what it should use, and what that gap costs at your own rates.
- Every site ranked against its weather-normalized baseline
- The gap priced in money from rate configuration
- A drill path from site to floor to line, so the ask has a cause
- Measured
- water, electricity and gas against baseline
- Decision
- fund the largest verified gap first
- Aqueduct
- ranks sites and shows why each one ranks there
Whether facility spend is under control
Utility and maintenance spend usually reaches leadership as a quarterly variance. By then the waste is paid for. A live view lets the business ask why while the month is still open.
- Current cycle accrued and projected before month end
- Cost changes split into usage, rate and weather
- Bills checked against your own meters before approval
- Measured
- consumption per billing period, per site
- Decision
- which variances need an owner
- Aqueduct
- explains the change, not just the total
Which assets could stop the business
A failed chiller in a hospital, a compressor in a cold store or a pump on a campus is an operating event, not a maintenance line. Early signs usually exist; the question is whether anyone is reading them.
- aQ PredictIQ watches vibration, sound signature and energy drift
- Faults arrive diagnosed with a recommended fix
- Repairs close only when the data says the asset is back in range
- Measured
- condition and operating state of critical assets
- Decision
- where planned work replaces emergency repair
- Aqueduct
- flags the asset before it fails
What the business can say in public
Sustainability and healthy building claims now draw questions from investors, lenders, customers and in some markets assurance providers. A claim is only as strong as the measured record behind it.
- Water, energy, carbon and air from the meter, not the invoice
- Every figure traceable to a device and a date
- Your team or consultant files; Aqueduct supplies the evidence
- Measured
- consumption, intensity, CO2 exposure
- Decision
- which targets the business can stand behind
- Aqueduct
- keeps the record that supports the claim
How acquisitions and new sites join the view
Every acquired building arrives with its own systems and vendors. Without a common layer, the portfolio view breaks a little with every deal.
- Uploading 6 to 12 months of bills gives a day-one baseline
- Device agnostic ingest across BACnet, Modbus, MQTT and LoRaWAN
- New developments can specify Aqueduct at design stage
- Measured
- the new site against its own history
- Decision
- integration priority after close
- Aqueduct
- brings the site onto aQ Core quickly
The metrics an executive gets, and the question each one answers
These are the numbers that roll up from aQ Core to a leadership view. Each is measured, each can be drilled into, and each is stated in money where that makes sense.
| Metric | What it measures | The question it answers |
|---|---|---|
| Performance against baseline | Actual use against what weather and history predict, per site | Are we getting better, or did the weather do it? |
| Cost of the gap | The baseline delta priced from your own utility rates | What is waste costing us this quarter? |
| Water and energy use intensity | Use per square foot and per visitor | Which sites are inefficient once size is removed? |
| Verified savings | Savings confirmed at the meter after a fix | Which projects actually paid back? |
| Billed versus metered | Utility invoices against your own measurement | Are we paying for what we used? |
| Open critical faults | Diagnosed faults on assets that matter to operations | What could stop a site next month? |
| CO2 exposure in zone-hours | Time occupied spaces spent above target | Are our healthy building commitments being kept? |
Why facility cost is a leadership topic now
rise in combined US household water and sewer bills from 2019 to 2024
Source: Bluefield Research: U.S. water and sewer bill has increased 24% in five yearsa year in uncaptured revenue from water lost in US utility networks, recovered through rates
Source: Water Online: Water losses cost U.S. utilities US$6.4B annually (Bluefield Research)Dubai's target cut in electricity and water demand by 2030, against business as usual
Source: MEED: Dubai updates energy savings targetHow to test Aqueduct without a portfolio-wide bet
Pick one representative site
Choose a site with a real water or energy story and an engaged facilities lead. It becomes the reference everyone else watches.
Upload the bills first
Six to twelve months of utility bills give a weather-normalized baseline and a rate configuration in the first week, before new metering is installed.
Connect what already exists
Existing meters, BMS points and controllers connect if they emit telemetry. Gaps are filled through installation partners.
Act on the first findings
Findings route into your CMMS. Where control is enabled, with owner approval, schedules and setpoints change and every command is logged.
Read the result at the meter
At the end of the quarter, verified savings and open risks are on one page. That page, not a proposal, decides the next sites.
sites in 21 countries run on Aqueduct.
and 9 clinics in one of India’s top hospital chains.
US airport running water intelligence on Aqueduct.
of commercial real estate under Aqueduct.
FMCG manufacturing campus.
operations run on Aqueduct.




Related
Common questions
Measure where water and energy go, compare each site with a weather-normalized baseline, fix what runs above it and verify each fix at the meter. Aqueduct runs this loop continuously across a portfolio.
Aqueduct gives leadership portfolio outcomes in water, energy and air, measured at the meter and stated in money. It also supplies the metered evidence behind sustainability commitments and ranks capital requests by measured gap.
Aqueduct is deployed in 275+ sites across 21 countries. Clients include a hospital chain with 22 hospitals and 9 clinics, a commercial real estate client with a 20M+ sq ft portfolio, and major dairy operations.
Aqueduct is a facility intelligence platform from Milvian AI, a product company. It uses IoT to sense and act, but does not sell hardware as its core business. Installation runs through partners.
Uploading 6 to 12 months of utility bills gives a day-one baseline, so performance against baseline is visible from the start. Savings follow as findings are acted on and verified at the meter.
No. Aqueduct measures savings rather than promising them. Each saving is verified at the meter against a weather-normalized baseline.
Ask which three sites have the largest gap against a weather-normalized baseline, what that gap costs at your own rates, and which savings from last year were verified at the meter. If the answers take a week to assemble, the data layer is the first problem to fix.
It ranks sites by measured gap against baseline and prices the gap in money. Retrofit requests can then be compared on evidence rather than on the strength of the proposal.
Aqueduct supplies metered, traceable water, energy, carbon and air data, with weather normalization and verified savings. Your team or consultant prepares the disclosure; Aqueduct supplies the record behind each number.
One representative site, its utility bills for a day-one baseline, and the existing meters and BMS points connected. The first quarter's verified results then decide where the platform goes next.
See Aqueduct on your own facility.
Bring a site, a utility bill or a question. We will show you where the loss is.