Measurement and verification software for owners who need savings proven at the meter.
Measurement and verification (M&V) proves that an energy or water saving actually happened, by comparing metered use after a change with a baseline adjusted for weather and conditions. Aqueduct is measurement and verification software that runs M&V continuously: weather normalized baselines, metered results, and an auditable record of every action that produced them.

Every saving measured at the meter, tied to the action that produced it.
Link the change on the equipment to the saving
- Command history
Every action on controlled equipment is recorded: what was sent, when, and whether it executed.
- Equipment level metering
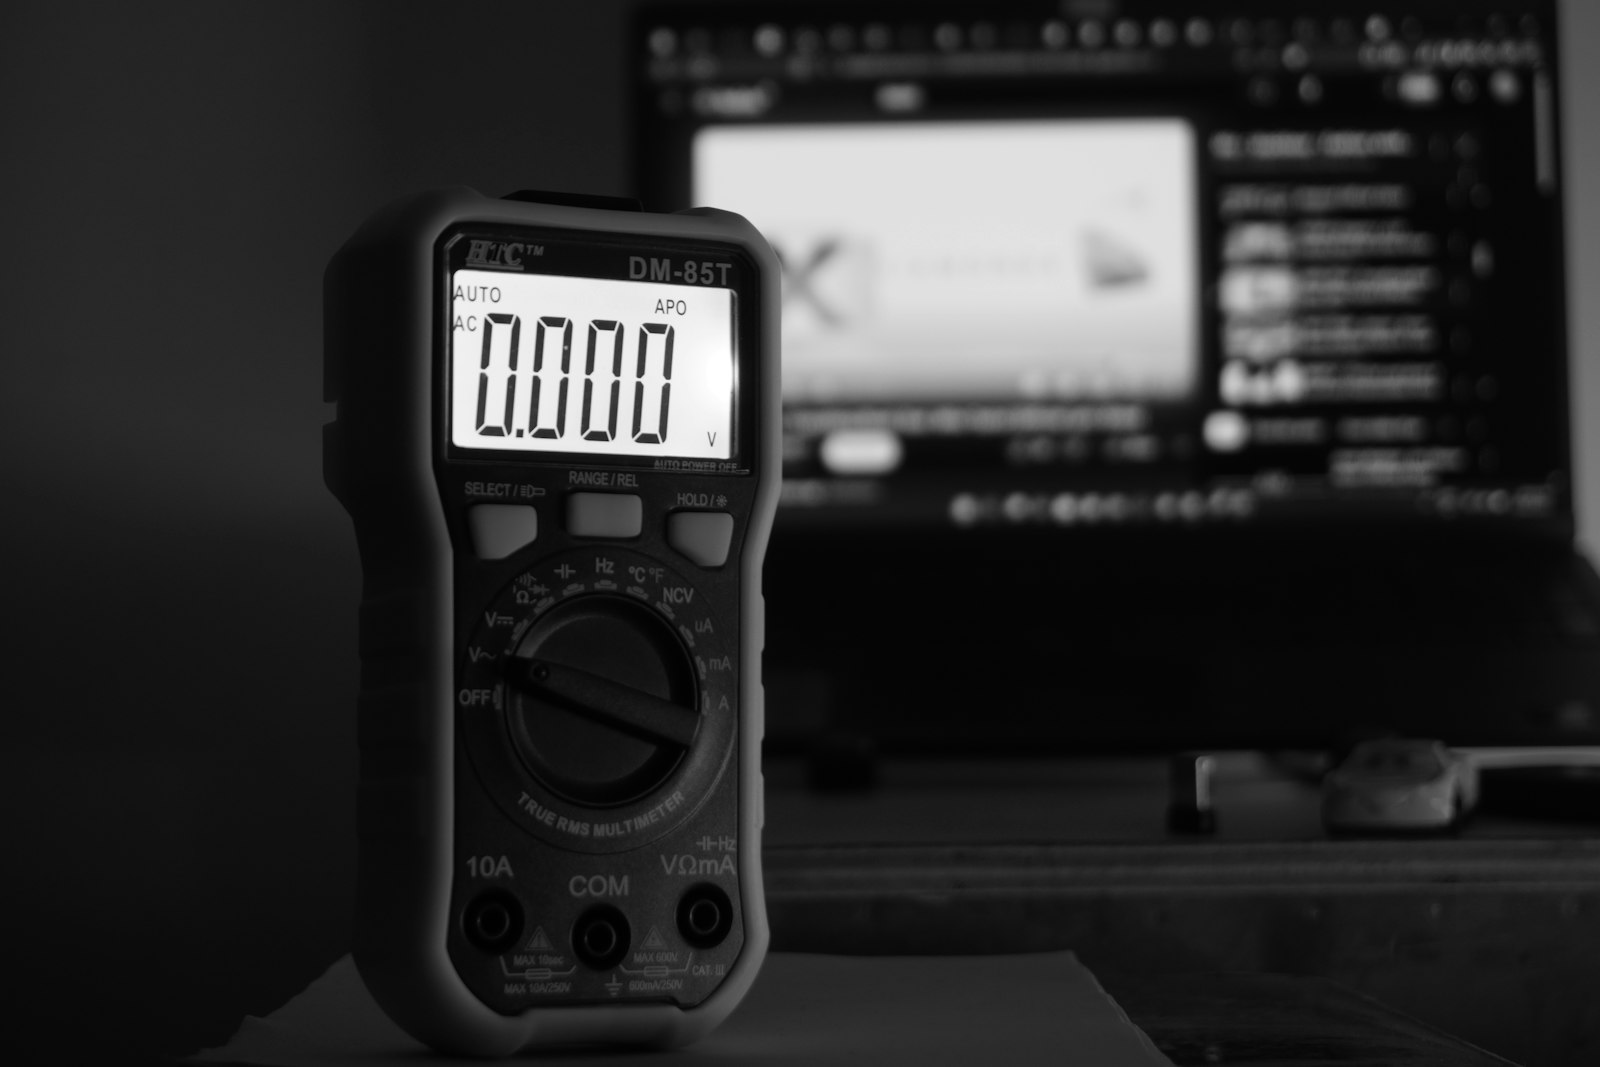
Power on the controlled asset shows the effect directly, not diluted in the whole site total.
- One clear thread
The recommendation, the approved action and the metered result sit together for anyone to review.
M&V that keeps running after the milestone
- Results become baselines
Each verified result becomes the next baseline, so savings that erode show up as drift.
- Persistence by default
Verification does not stop when the contract milestone is signed. It runs every period after.
- Adjusted for weather
Every comparison uses the weather normalized baseline, so a mild month cannot pass as a saving.

Numbers a vendor, tenant or auditor can check
- Bill validation
Supplier bills are checked against your own meters, separating usage changes from rate changes.
- Report-ready metrics
Verified results export as monthly metrics. Aqueduct supplies the numbers, your team files the report.
- Data quality shown
Meter connectivity and coverage are visible, so everyone knows how much data stands behind a result.

Measurement and verification, before and after Aqueduct
- The engineering estimate is reported back as the result.
- M&V happens once for a milestone, then stops.
- Nobody can tie a saving to a specific change on equipment.
- Savings quietly drift away after the project closes.
- Disputes with vendors and auditors run on thin evidence.
 The Aqueduct way
- Savings are measured at the meter against an adjusted baseline.
- Verification runs every period, long after the milestone.
- Command history ties each action to its metered result.
- Each result becomes the new baseline, so drift is caught.
- Every disputed number comes with meter data and command records.
What M&V looks like without Aqueduct
Savings are often estimated, reported once and never checked again.
Savings by engineering estimate
A project is approved on a calculated saving, and the same calculation is reported as the result.
A one-time study
M&V is done for a contract milestone, then stops. Savings drift away and nobody sees it.
No link from action to result
Nobody can show which change, on which equipment, produced which saving.
Disputes without data
When a vendor, tenant or auditor questions the number, the evidence is thin.
How M&V works in Aqueduct
Powered by aQ EnergySmart, with Billing Management and Smart Controls command history.
Set the baseline first
A weather normalized baseline is built from usage plus cooling and heating degree days, before any saving is claimed.
Meter the change
Whole-site and sub-meter data, or equipment-level power for controlled assets, measure what actually happened.
Compare actual to adjusted baseline
Savings are the difference between adjusted baseline use and actual use, priced through rate configuration.
Keep the evidence
Command history records every action on controlled equipment: what was sent, when, and whether it executed. Bills, meters and actions sit on one data layer.
Make the result the new baseline
Every verified result becomes the baseline for the next round, so savings that erode show up.
One saving, verified
An illustrative case after an HVAC optimization.
RTU power and the site main report into Aqueduct, along with occupancy.
The RTU has a weather normalized baseline from months of history before the change.
Fans run outside occupied hours. Aqueduct recommends an occupancy-based schedule.
With owner approval, the schedule is applied through the field device controller. Command history logs it.
Metered RTU energy falls below the adjusted baseline in the following weeks, and the saving is reported in energy and cost.
Problem, solution, impact
Savings claimed but not measured.
Continuous comparison against a weather normalized baseline.
Savings verified at the meter against a weather-normalized baseline.
Water projects with no proof of effect.
The same M&V method on water meters and lines.
Water savings reported with the same rigor as energy.
No audit trail for controls claims.
Command history on every controlled device.
A saving tied to the action that produced it.

What you get
Adjusted baselines
Weather normalized, per site, line or asset.
Metered savings
Actual against expected, in units and in money.
Command history
Every action on controlled equipment, and whether it executed.
Bill validation
Supplier bills checked against your own meters.
Persistence tracking
Each result becomes the new baseline, so drift is caught.
Report-ready metrics
The verified numbers behind your reports. We supply them; you file.
Where it fits
- M&V
- BEMS savings reporting
- CMMS
- EAM
- Historians
Aqueduct does not estimate savings it cannot measure, and it does not file reports. It supplies the verified metrics.
Related standards and programs
Aqueduct supplies metered data for these methods. Check the current rule for your contract or program.
Where teams put it to work
Savings proven, not projected
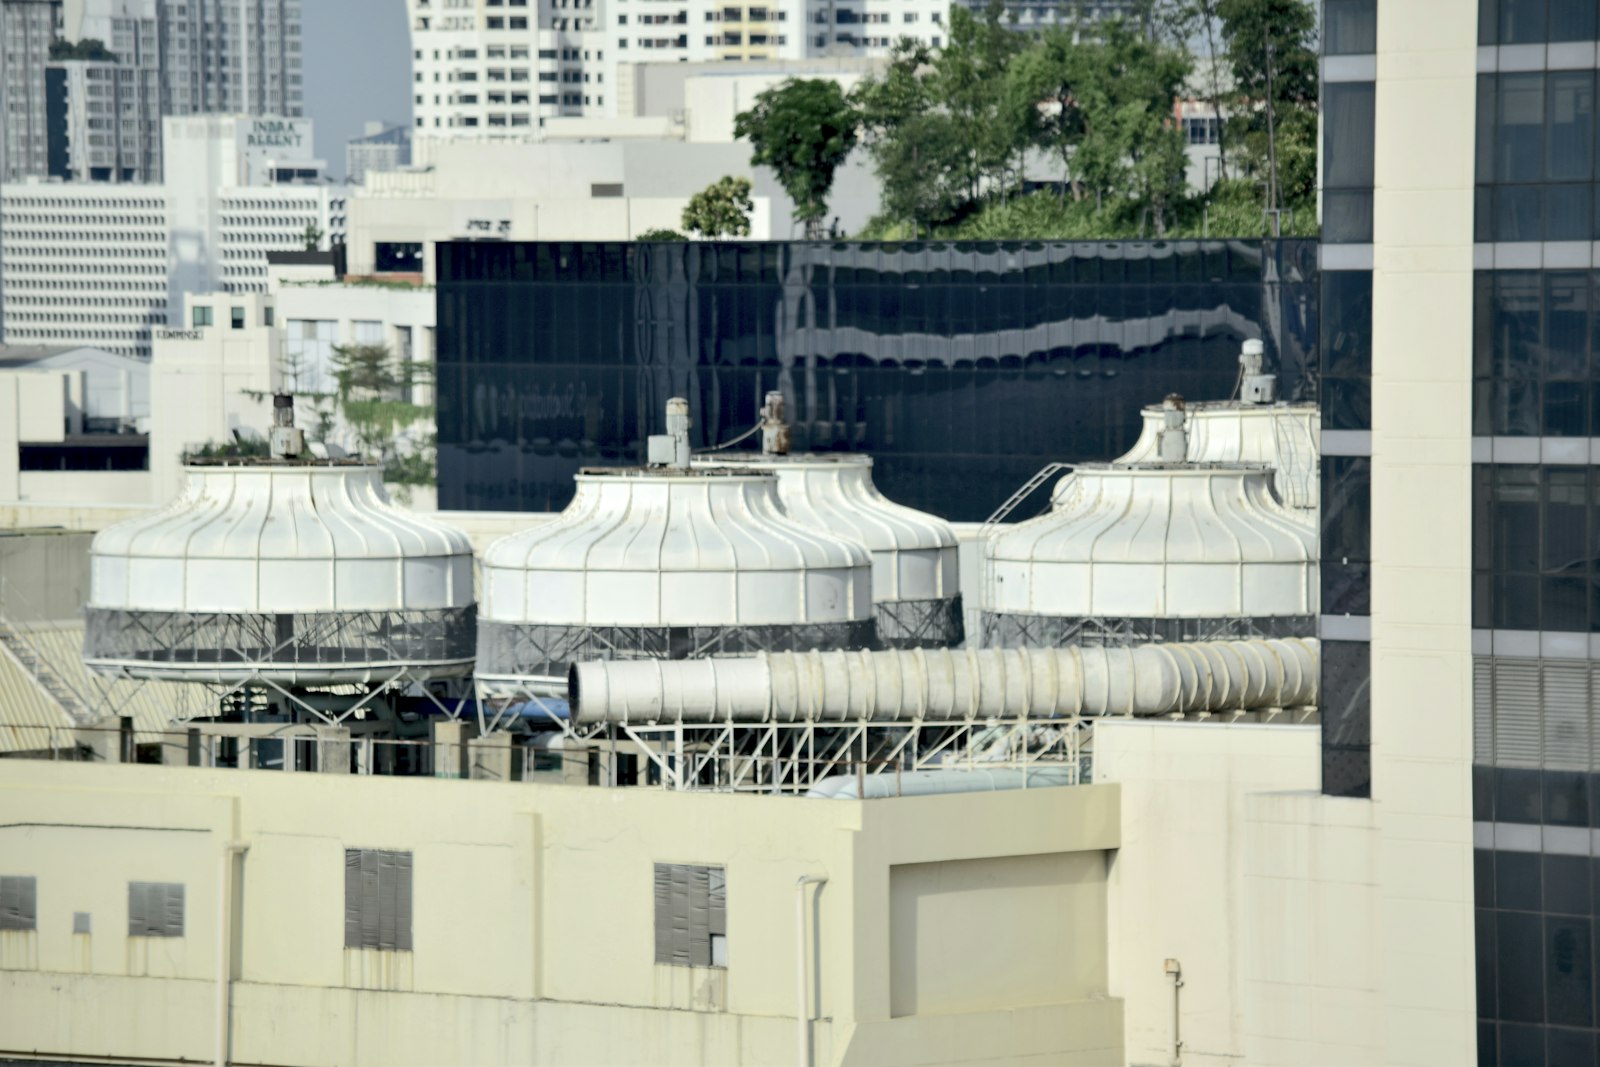
An occupancy-based schedule on a rooftop unit is applied with owner approval, then metered against its adjusted baseline in the weeks that follow.
Learn more
Results public budgets can rely on
Counties and cities report savings measured at the meter, with the command record behind each change kept for review.
Learn more
The verified numbers behind the report
Metered water, energy and carbon results export as monthly metrics, ready for the reports and certifications your team files.
Learn moreRelated
Common questions
M&V is the practice of proving a saving by comparing metered use after a change with a baseline adjusted for weather and conditions.
IPMVP is a protocol that defines options for verifying savings. Aqueduct supplies the metered baselines and results those methods rely on. Your M&V plan sets which option applies.
No. It reports savings it can measure at the meter against a baseline set before the claim.
Yes. Any change at a metered site, from a retrofit to a schedule fix, is measured against the same adjusted baseline.
No. It supplies the verified metrics. Your team files.
See Aqueduct on your own facility.
Bring a site, a utility bill or a question. We will show you where the loss is.