Find every leak and loss, fix it, prove it.
Most facilities have one meter at the inlet. If consumption doubles overnight, nobody knows until the bill arrives. Aqueduct sub-meters the network, closes the water balance live and verifies every fix at the meter.
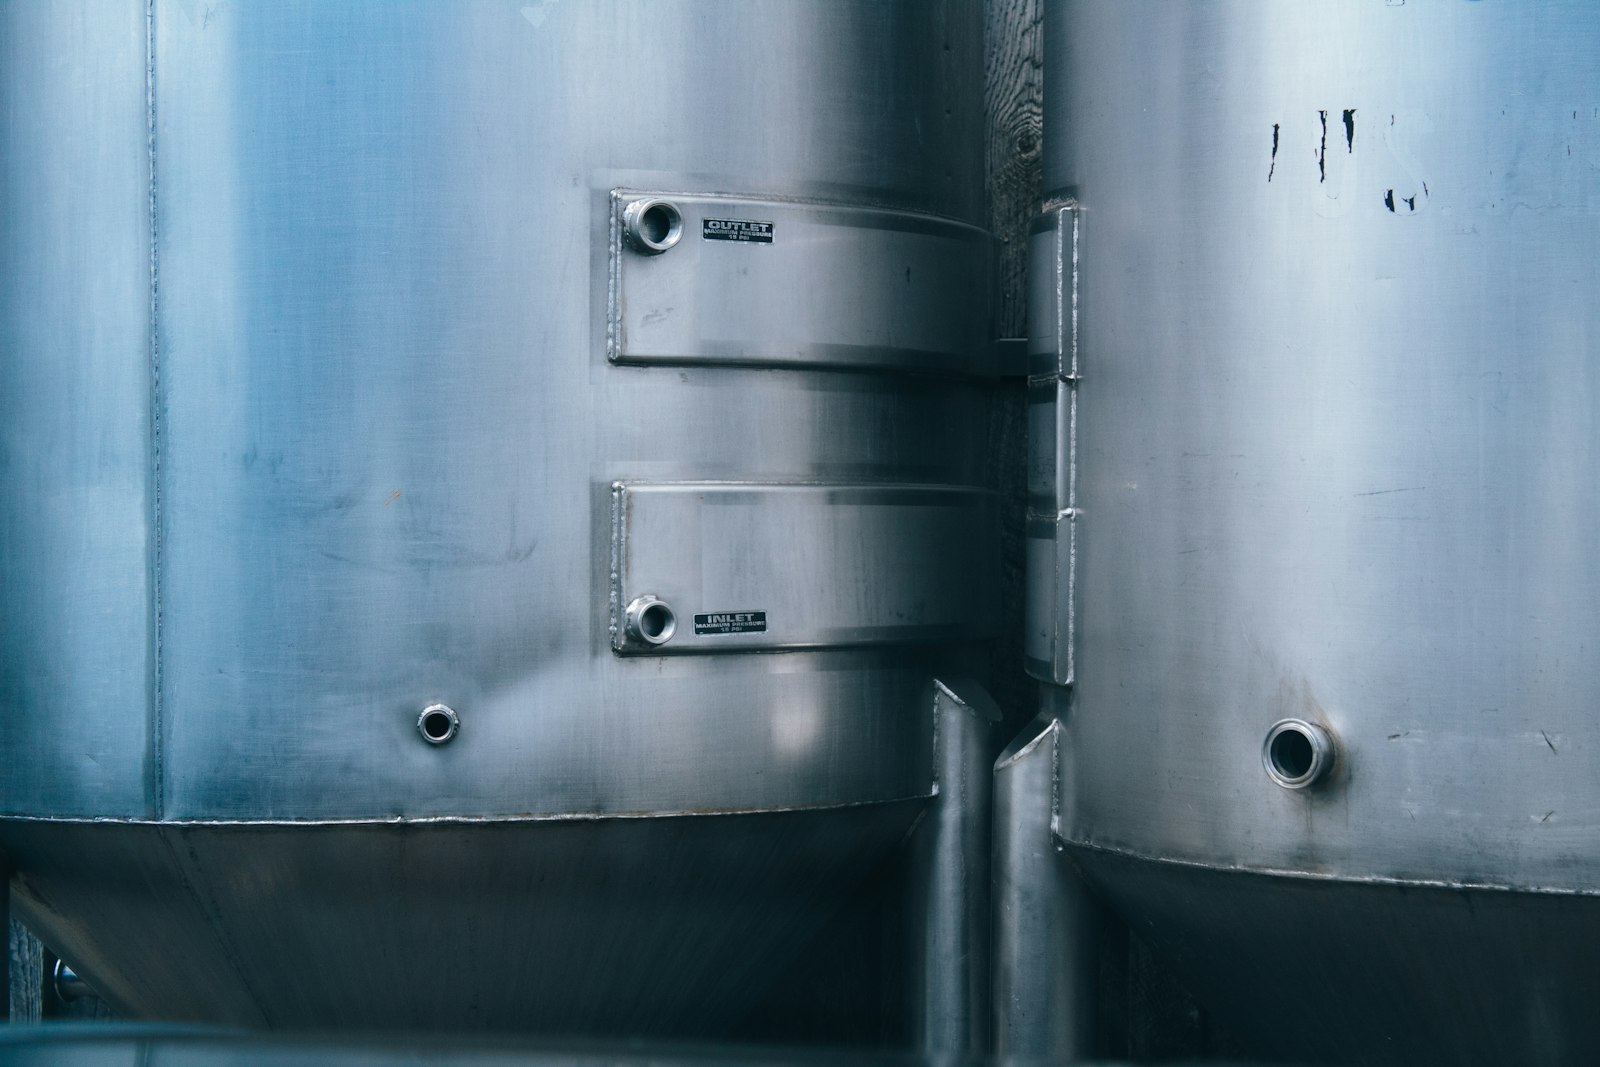
Find every leak and loss, fix it, and prove the result at the meter.
Water use attributed to every floor, line and plant
- Beyond the main incomer
Sub-meters on floors, risers, process lines, RO and STP show where every gallon goes.
- Existing meters count
Any meter that emits telemetry connects. New meters are specified and installed through partners.
- Drill to the hour
Usage drills from line to month, day and hour, instead of waiting for the monthly bill.
Unaccounted loss located, priced and routed
- Loss with a location
Unaccounted flow is narrowed to the block, line or node where the balance stops closing.
- Cost per month
Rate configuration from your bills turns lost water into money, so repairs are prioritized by cost.
- Routed with evidence
Tickets go into your CMMS with the trace and a recommended fix. Your CMMS runs the work.
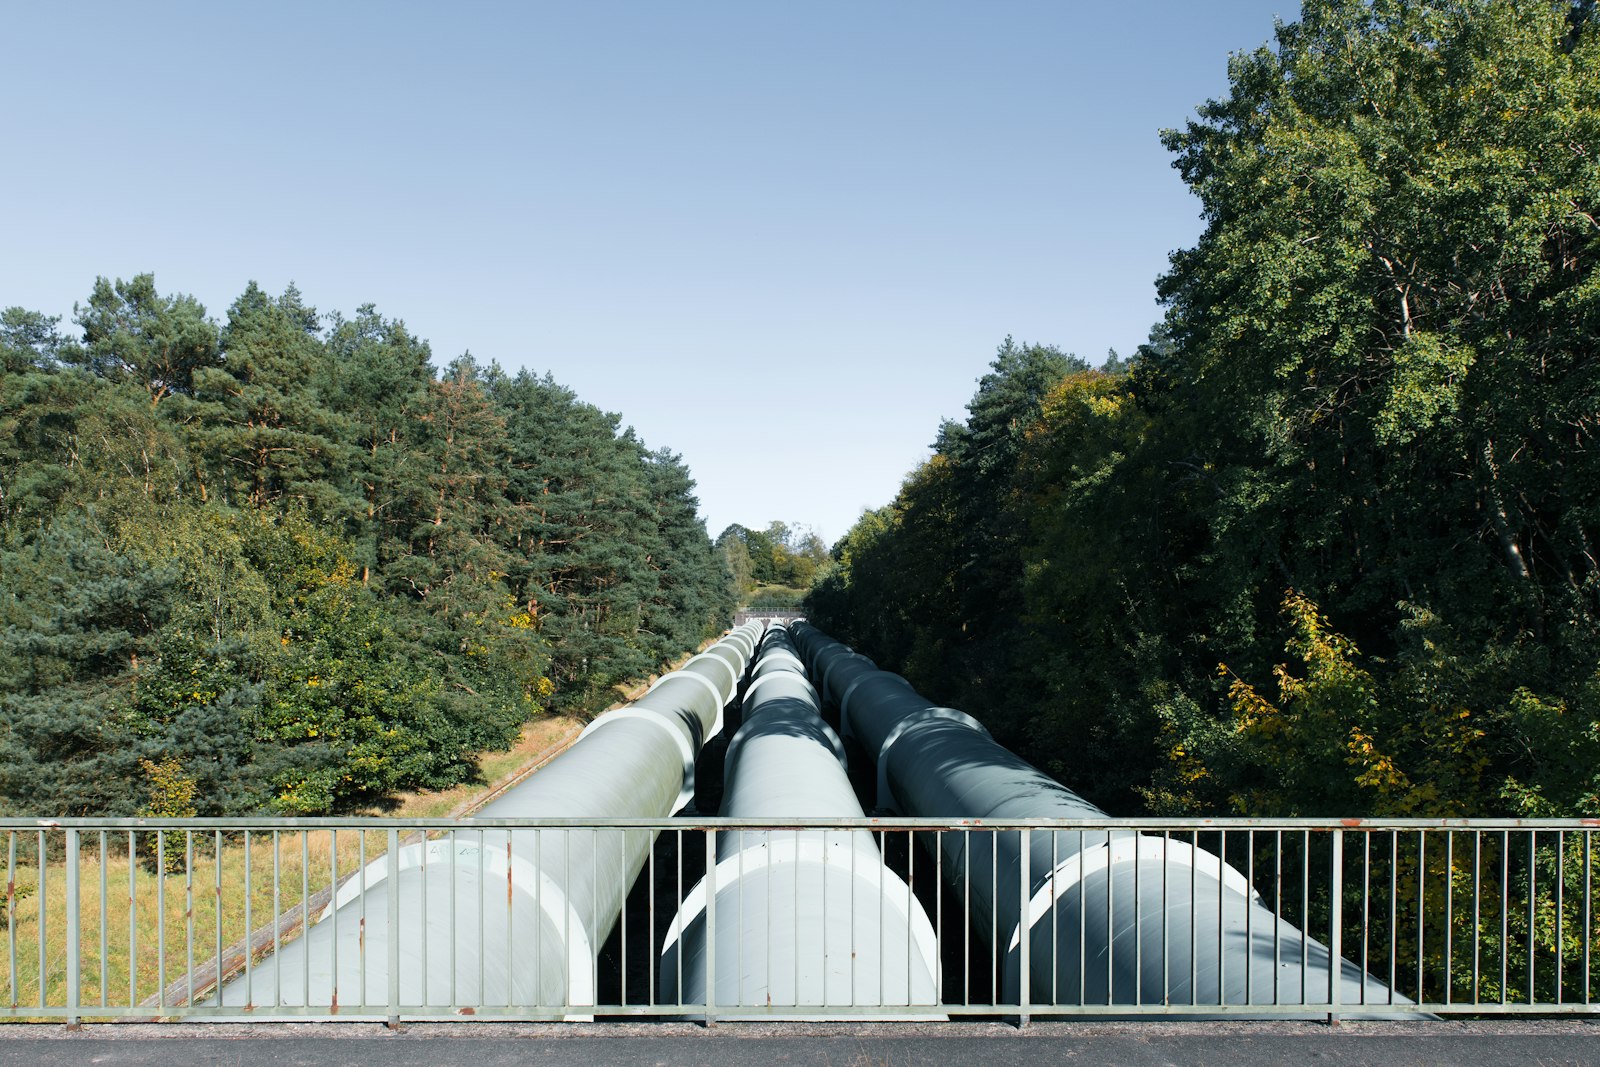
From one building to a utility network
- District metered areas
Zone inflow is balanced against billed use, so non-revenue water gets a location.
- Alongside SCADA
Aqueduct reads network data from SCADA, historians and AMI. Control stays with SCADA.
- Burst isolation
Where valves are connected, isolation runs only with owner approval, and every command is logged.
Water, before and after Aqueduct
- The utility bill is the leak alarm.
- One meter at the inlet says nothing about where water goes.
- Treatment plants are checked by hand, if at all.
- Lost water stays a volume, never a cost.
- Repairs are closed without anyone checking the meter.
 The Aqueduct way
- The live water balance is the leak alarm.
- Sub-meters attribute use to every floor, line and plant.
- STP and RO efficiency are tracked every hour on the twin.
- Rate configuration turns every loss into a monthly cost.
- The meter confirms every fix before the loop closes.
You cannot fix water you cannot see.
Water loss hides in the gaps between one inlet meter, a monthly bill and the plant room.
One meter, one monthly bill
A traditional facility meters the main incomer, often without a smart meter. Waste is discovered weeks after it starts.
Loss nobody can attribute
Without sub-metering there is no breakdown by floor, line, process or plant, so there is nowhere to send a crew.
Treatment plants run blind
STP and RO efficiency are rarely tracked live, so recovery and reuse slip without anyone noticing.
From the inlet to the last tap, then proof at the meter.
Every water claim runs the same loop. The verified result becomes the next baseline.
Monitor
Smart meters at the main incomer, floors, lines, RO and STP, with flow, pressure, level, temperature and TDS sensors.
Measure
A live water balance: main supply equals all floors, fire system, RO feed and unaccounted loss. Water use intensity per square foot and per visitor.
Identify
Unaccounted loss and water waste events, drilled from line to month, day and hour. Sankey views show where water enters and ends up.
Act
The leak goes into your CMMS with the line, the floor and a recommended fix.
Verify
Actual use against a weather normalized baseline, converted into money through your rate configuration.
The water balance, term by term
The equation
Total intake equals all floors, plus the fire system, plus RO feed, plus cooling tower makeup, plus irrigation, plus unaccounted loss. The aQ WaterGuard digital twin renders the site's version of this as a live equation in GPM, built block by block to match what is actually installed.
Intake
Every source is metered at entry: municipal supply, borewell, tanker deliveries and recycled water returning to the network. Tank levels are read live, because a filling or emptying tank shifts the balance for hours.
Consumers
Floors carry cold and hot water flows and per visitor use. The fire system should draw nothing outside tests, so any steady flow there is a fault. RO feed, tower makeup and irrigation are metered as their own lines.
Unaccounted loss
Whatever intake the metered consumers do not explain. It is the leak signal. The shape matters: a constant remainder points to a continuous leak or an unmetered line, a night time remainder to fixtures running in empty buildings, a remainder that follows irrigation hours to a broken zone.
Coverage first
A balance is only as good as the share of flow that is metered. If a large consumer is unmetered, its use is indistinguishable from loss. The twin shows which lines are reporting, so coverage gaps are fixed before loss is chased.
Cooling towers: makeup, blowdown and cycles of concentration
On sites with a chiller plant, cooling towers are often the largest single water user. Their water use follows a balance of its own, published by the US Department of Energy as makeup equals evaporation plus blowdown plus drift.
Evaporation follows the heat rejected
Towers cool water by evaporating part of it. Evaporation rises with the heat the chillers reject, so it tracks cooling load and weather. It is the part of tower water use that cannot be avoided, only reduced by reducing cooling load.
- Cooling load from the chiller plant
- Range across the tower and recirculation flow
- Evaporation trended against weather
- Measured
- condenser water temperatures, flow, cooling load
- Link
- every ton of cooling saved also saves water
- Aqueduct
- energy and water on one data layer
Cycles of concentration
As water evaporates, dissolved solids stay behind. Cycles of concentration is the ratio of dissolved solids in the blowdown to those in the makeup, measured as conductivity. It is also roughly makeup volume divided by blowdown volume.
- Conductivity of makeup and tower water
- Cycles computed both ways, and checked against each other
- Target set by water treatment limits on scale and corrosion
- Measured
- makeup and blowdown conductivity and flow
- Derived
- cycles of concentration
- Aqueduct
- tracks cycles hour by hour against target
Blowdown
Blowdown removes concentrated water to hold cycles at target. Blowdown equals evaporation divided by cycles minus one, so each extra cycle cuts blowdown, with smaller gains at higher cycles. A blowdown valve stuck open sends treated water straight to drain.
- Blowdown flow metered as its own line
- Blowdown against what the cycles target implies
- Continuous blowdown at night flagged
- Measured
- blowdown flow and conductivity
- Risk
- stuck valve or controller set too low
- Aqueduct
- compares actual blowdown with the expected value
Drift and overflow
Drift is water carried out of the tower as droplets, limited by drift eliminators. Overflow from a basin with a faulty float valve is a common, silent loss that shows up as makeup the evaporation cannot explain.
- Makeup minus evaporation minus blowdown as the unexplained term
- Basin level where measured
- Float valve faults found from the remainder
- Measured
- makeup, blowdown, basin level
- Derived
- tower water remainder
- Aqueduct
- routes the finding with the trace
Blowdown and condensate recovery
Blowdown can be treated and reused, and AHU condensate, which is low in minerals and highest when cooling load peaks, can feed tower makeup. Both claims need metering to be counted.
- Recovered blowdown metered
- Condensate return to the tower metered
- Reuse reported separately from intake
- Measured
- recovered volumes by stream
- Evidence
- reuse from the meter, not the design
- Aqueduct
- reuse lines on the water twin
STP and RO performance, calculated from the twin
Treatment plants are where recovered water is made and where it is quietly lost. These are the figures the twin computes from the plant meters and quality sensors.
| Measure | Calculation | Meters and sensors | What a drift means |
|---|---|---|---|
| RO recovery | Permeate flow divided by feed flow | Feed and permeate flow meters | Membrane fouling, scaling or a recovery setpoint changed |
| RO reject | Feed minus permeate, or the reject meter | Reject flow meter, reject destination | More water to drain than designed |
| Salt rejection | One minus permeate TDS divided by feed TDS | TDS in and out | Membrane damage or seal failure |
| Concentration factor | One divided by (one minus recovery) | Derived from recovery | How concentrated the reject is, which limits reuse and scaling margin |
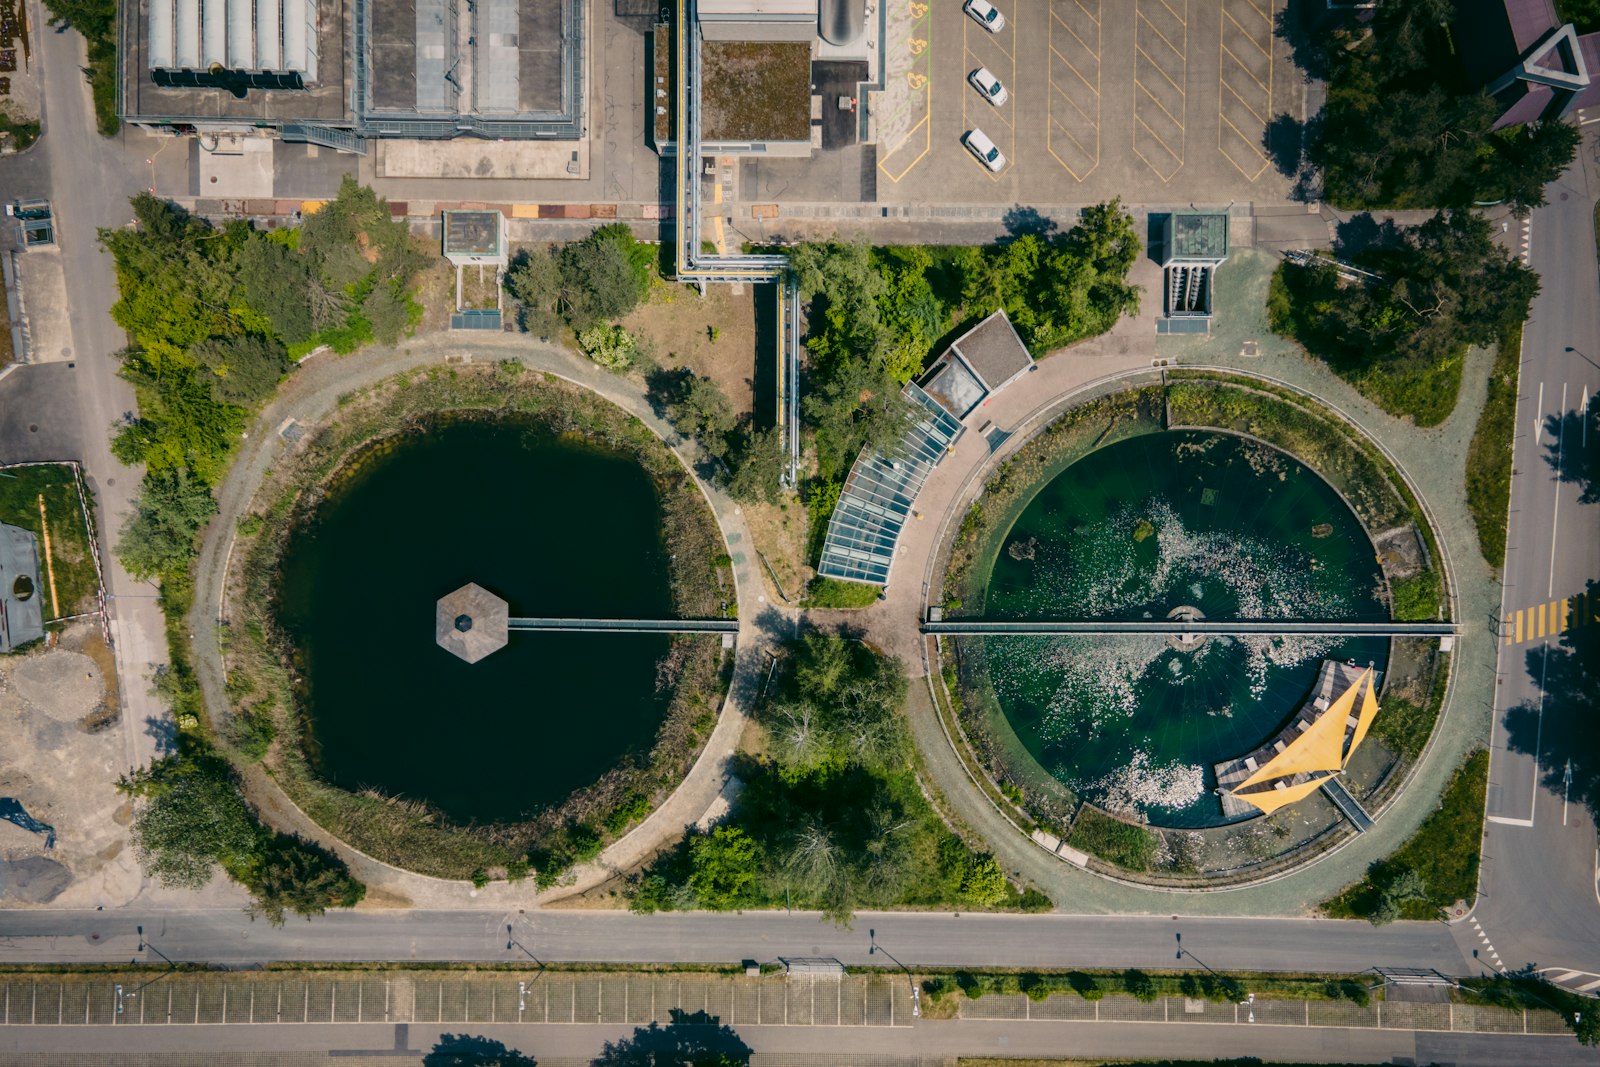
| STP efficiency | Treated output against inlet, as shown on the twin | Inlet and treated flow meters | Losses in sludge, overflow or bypass |
| STP outlet quality | BOD out in mg/L | Quality sensor at the outlet | Treated water unfit for its reuse destination |
| Reuse flow | Treated water returned to flushing, irrigation or towers | Reclaimed water line meter | Recycled water going to drain instead of reuse |
| Reuse share | Reuse flow divided by total demand | Reuse and intake meters | Fresh water replacing reuse it should not need to |
Loss points on a typical campus
Each of these leaves a mark on the balance. The twin shows which term moved, which narrows the search to a block, a line or a plant.
Tanks
Overflow from a failed float or level control, often at night when refilling.
Tank level and inlet flow
Inlet flow with a full tank raised as a waste event
Distribution headers
Underground or in-wall leaks running continuously.
Header flow against the floors it feeds, pressure
Constant remainder located to the header
Floors and restrooms
Running fixtures and flush valves in empty buildings.
Floor flow against visitors and time of day
Night flow per floor, gal per visitor trends
Fire system
Steady draw on a system that should be static.
Fire line flow and pressure
Any flow outside a scheduled test flagged
Cooling towers
Stuck blowdown, overflow, cycles below target.
Makeup, blowdown, conductivity
Tower balance and cycles against target
RO plant
Recovery slipping, reject running to drain.
Feed, permeate, reject, TDS
Recovery and salt rejection trended hourly
STP
Treated water lost to bypass or overflow, quality drifting.
Inlet, treated flow, BOD out
Efficiency and outlet quality on the twin
Irrigation
Broken zones, schedules running in rain.
Irrigation line flow against schedule and weather
Flow outside schedule or in wet weather flagged
From one inlet meter to a closed balance
The balance closes in stages, as coverage grows.
Bills and the main meter
Six to twelve months of bills set a weather-normalized baseline, and the main incomer meter starts reporting.
Major consumers
Existing smart meters connect. New meters on floors, towers, RO, STP and irrigation are specified and installed through partners where lines are blind.
The twin closes
The balance is built block by block for the site. Unaccounted loss becomes a live figure, and coverage gaps are listed.
Loss and recovery
Waste events route to your CMMS with the trace. Tower, RO and STP performance is tracked against target, and every fix is confirmed at the meter.
Sources1 references cited on this page
Every gallon should be accounted for, from the inlet to the last tap.
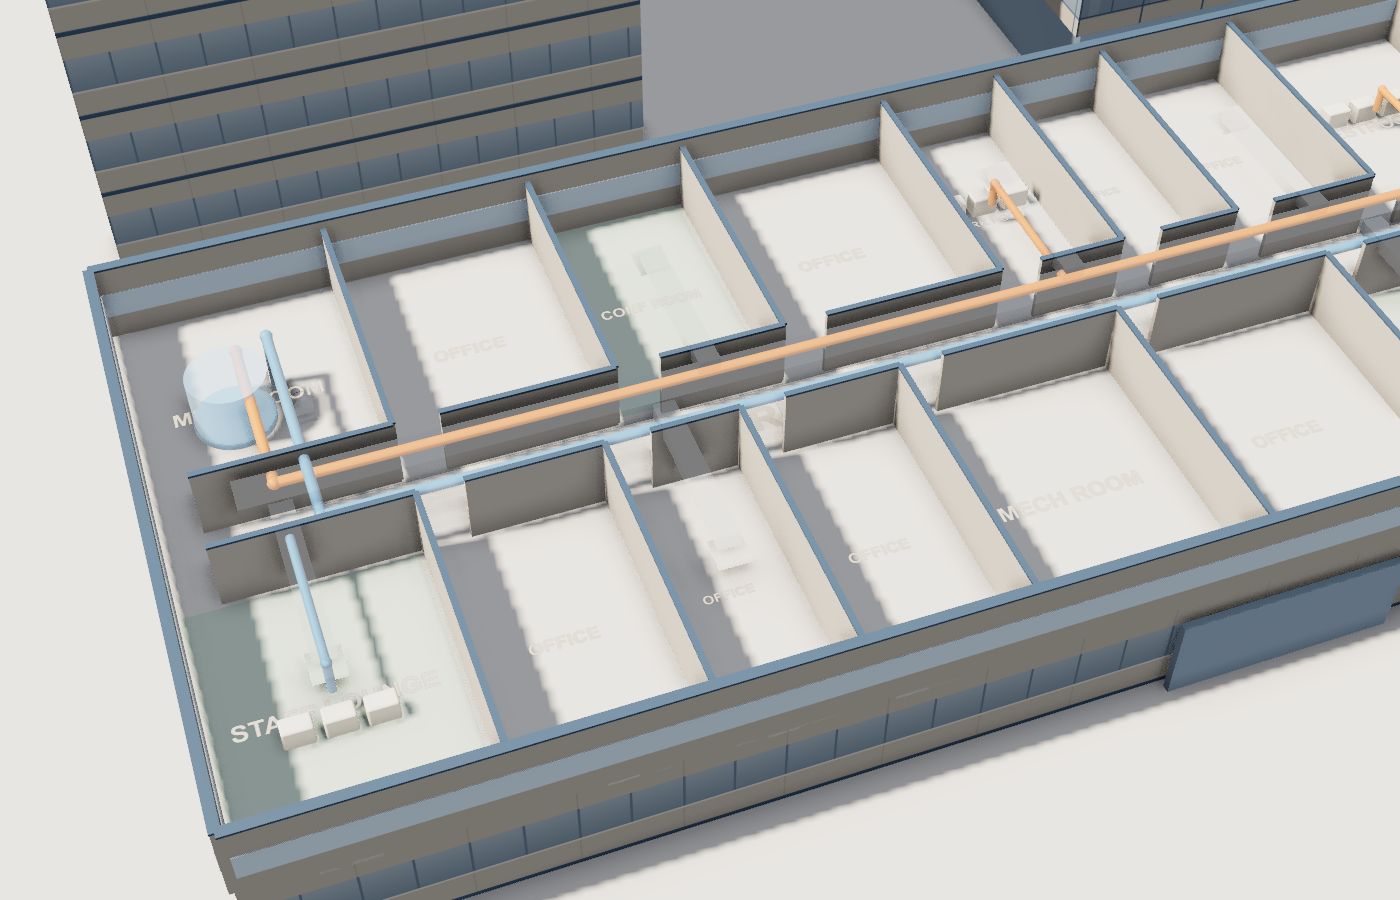
Talk to our teamA live schematic of your water system, built block by block.
Tanks with live levels, hot and cold headers, every floor, the RO unit and the STP. Updated every 60 seconds and matched to what is actually installed at the site.
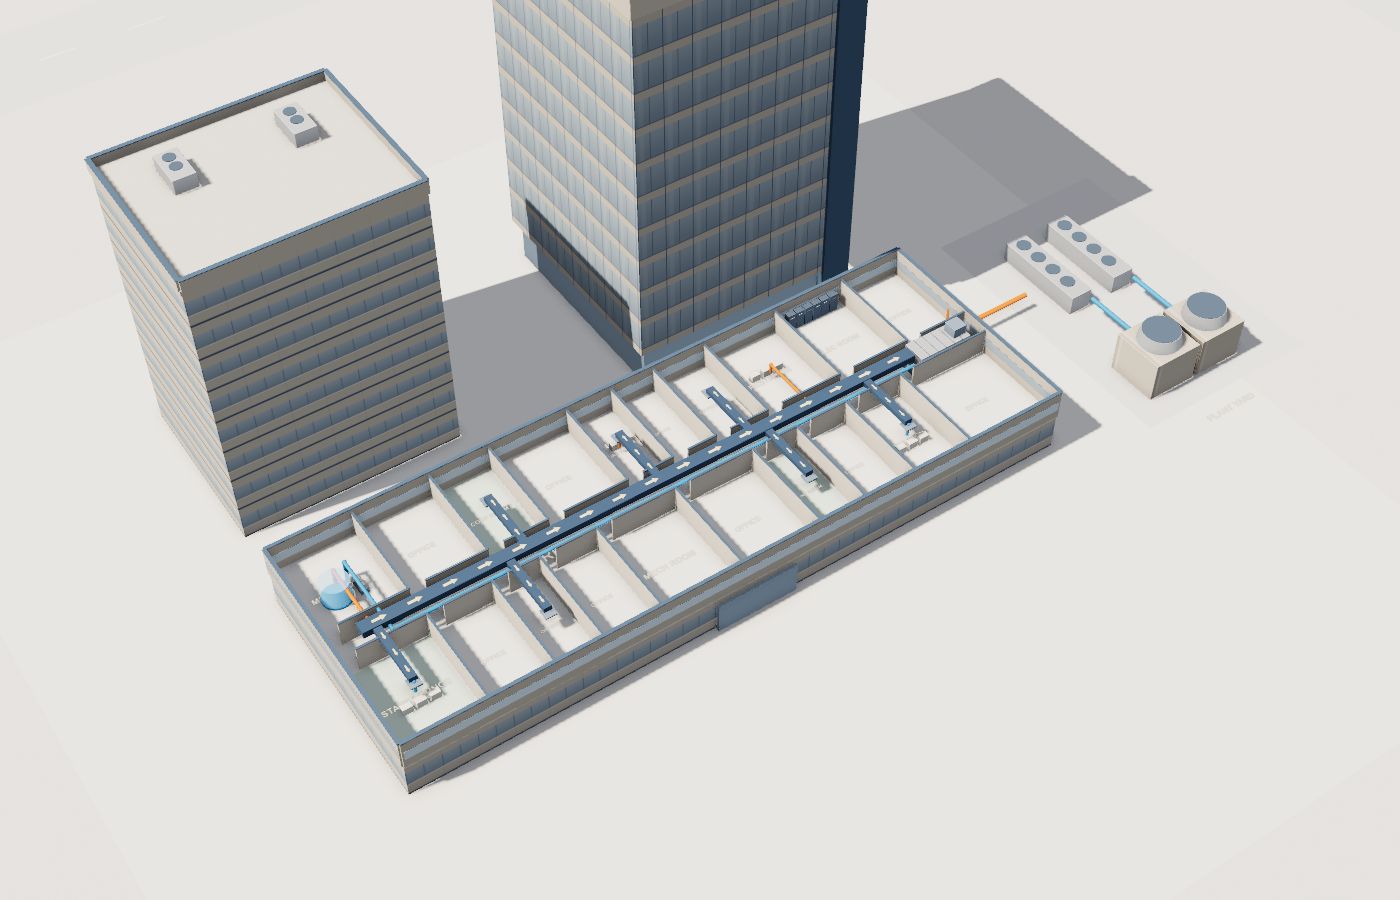
Results on day one, not after a year of monitoring.
Upload six to twelve months of utility bills and Aqueduct builds an expected baseline from your history and cooling and heating degree days. Below baseline is saving. Above is waste.
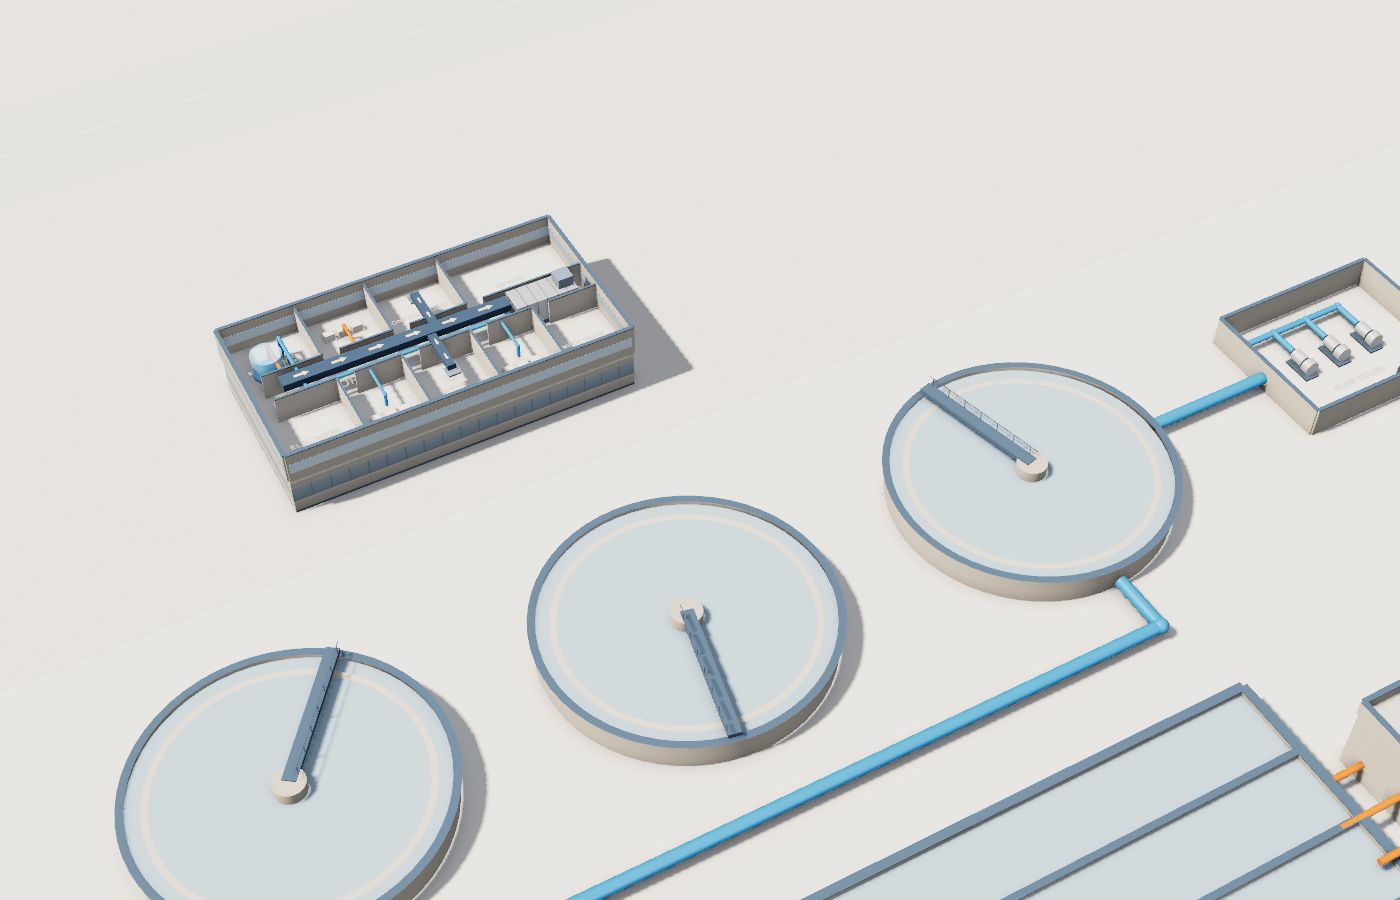
STP and RO performance, every hour.
Inlet, treated flow, efficiency and BOD out for the STP. Feed, permeate, recovery and TDS for RO. Reclaimed water is tracked as its own line.
Found from the balance, not the bill.
Water results from live sites, verified at the meter.
water savings customers see.
sites in 21 countries.
Where teams put it to work
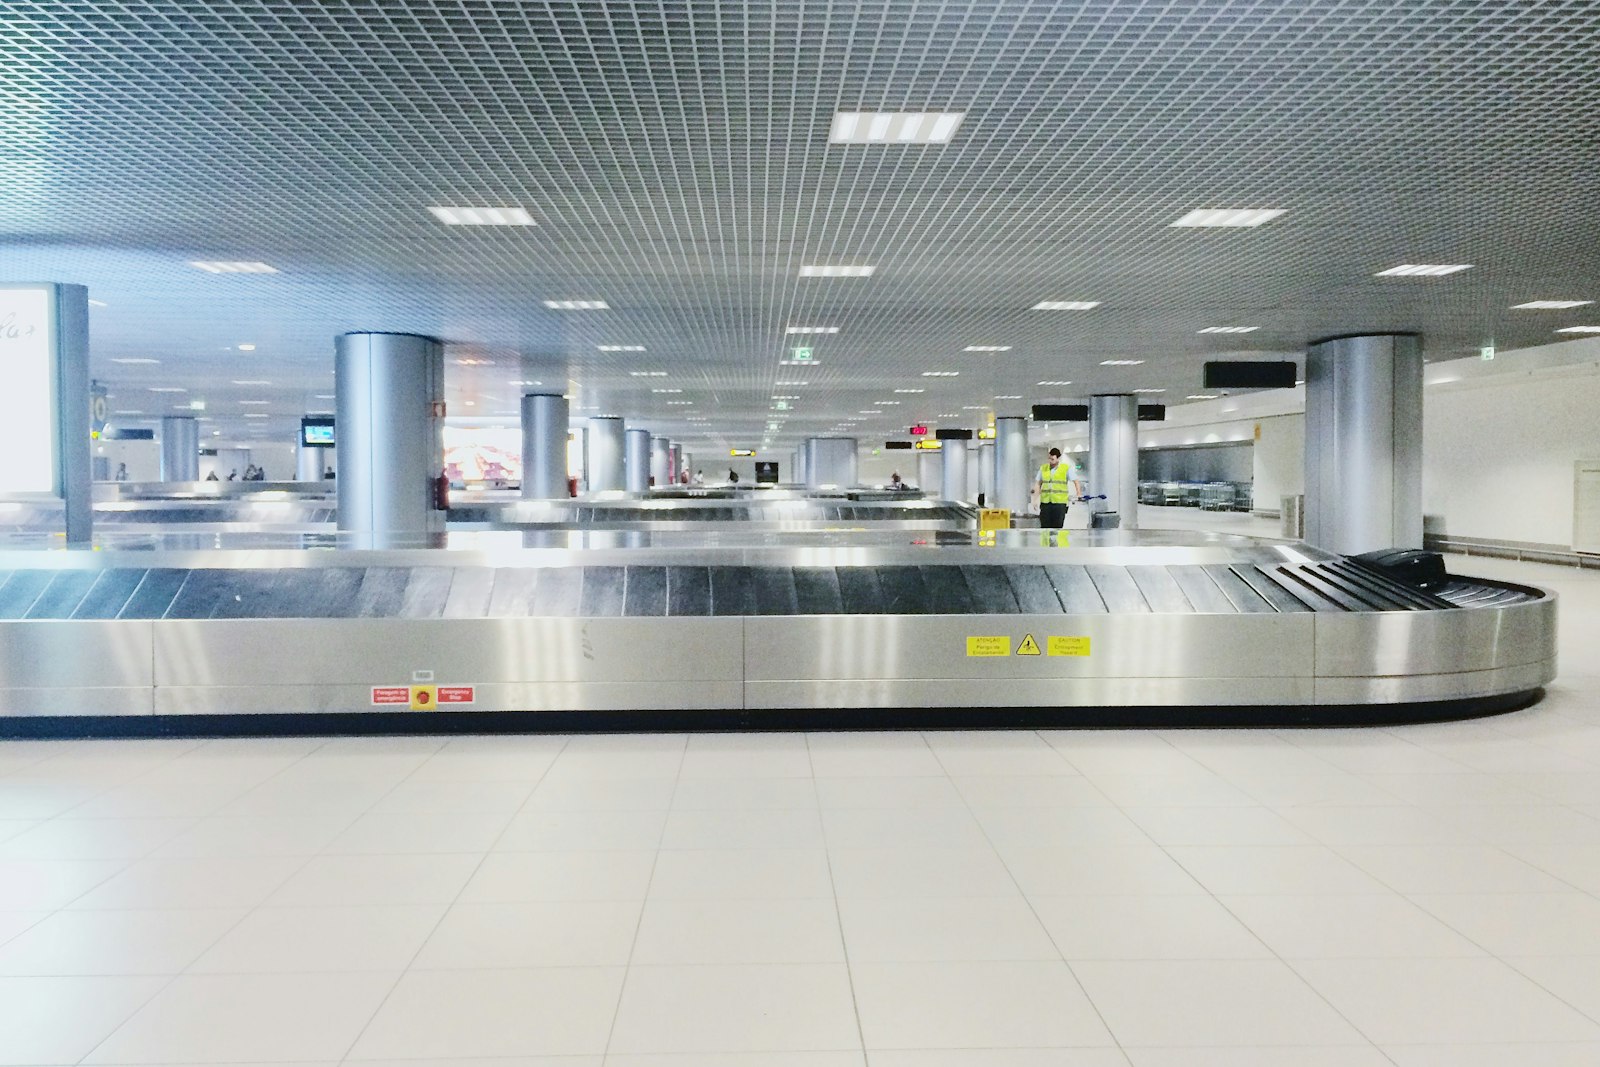
Thousands of meters, one water balance
Proof from the field: customers see up to 50% water savings.
Learn more
Metered results for water-positive goals
Withdrawals, reuse and loss metered in one balance give water stewardship goals site-level evidence, read the same way at every site.
Learn more
Network loss with an address
District metered areas are balanced against billed use, so leak survey work goes to the zones where loss is real.
Learn moreWater, energy, air and operations on one platform.
Common questions
Aqueduct works with anything that emits telemetry, including existing smart water meters. Where a line is not metered, sub-meters are specified and installed through partners.
It is the part of the main supply that the floors, fire system and RO feed do not account for. It is the clearest signal of a leak.
Upload six to twelve months of utility bills and performance against a weather normalized baseline shows from the first day.
Yes. STP and RO efficiency, recovery, reuse and water quality readings sit on the same twin as the building network.
Because on many sites they are among the largest consumers. If they are not metered as their own terms, their use hides inside unaccounted loss and the leak signal becomes meaningless.
As the ratio of dissolved solids, measured as conductivity, in the blowdown to that in the makeup. It can also be estimated as makeup volume divided by blowdown volume, and the two methods are checked against each other.
Blowdown equals evaporation divided by cycles minus one. Raising cycles reduces blowdown, with smaller gains each step, up to the limit your water treatment sets for scale and corrosion.
More of the feed is going to reject for the same permeate. Common causes are membrane fouling or scaling, a changed setpoint, or a feed water change. Salt rejection and TDS readings help tell them apart.
Yes, where the reuse lines are metered. Recovered blowdown, condensate and treated STP water are carried as their own lines on the twin.
See Aqueduct on your own facility.
Bring a site, a utility bill or a question. We will show you where the loss is.