Peak demand management for facilities that pay for their highest interval.
Peak demand management keeps a facility's highest interval of power draw below the level that triggers higher charges or a higher tariff band. Aqueduct shows the peak building in real time, then pre-cools, staggers or sheds loads through connected equipment where control is enabled and the owner approves, logging every command.
See the peak coming, move the right loads, and prove the interval held.
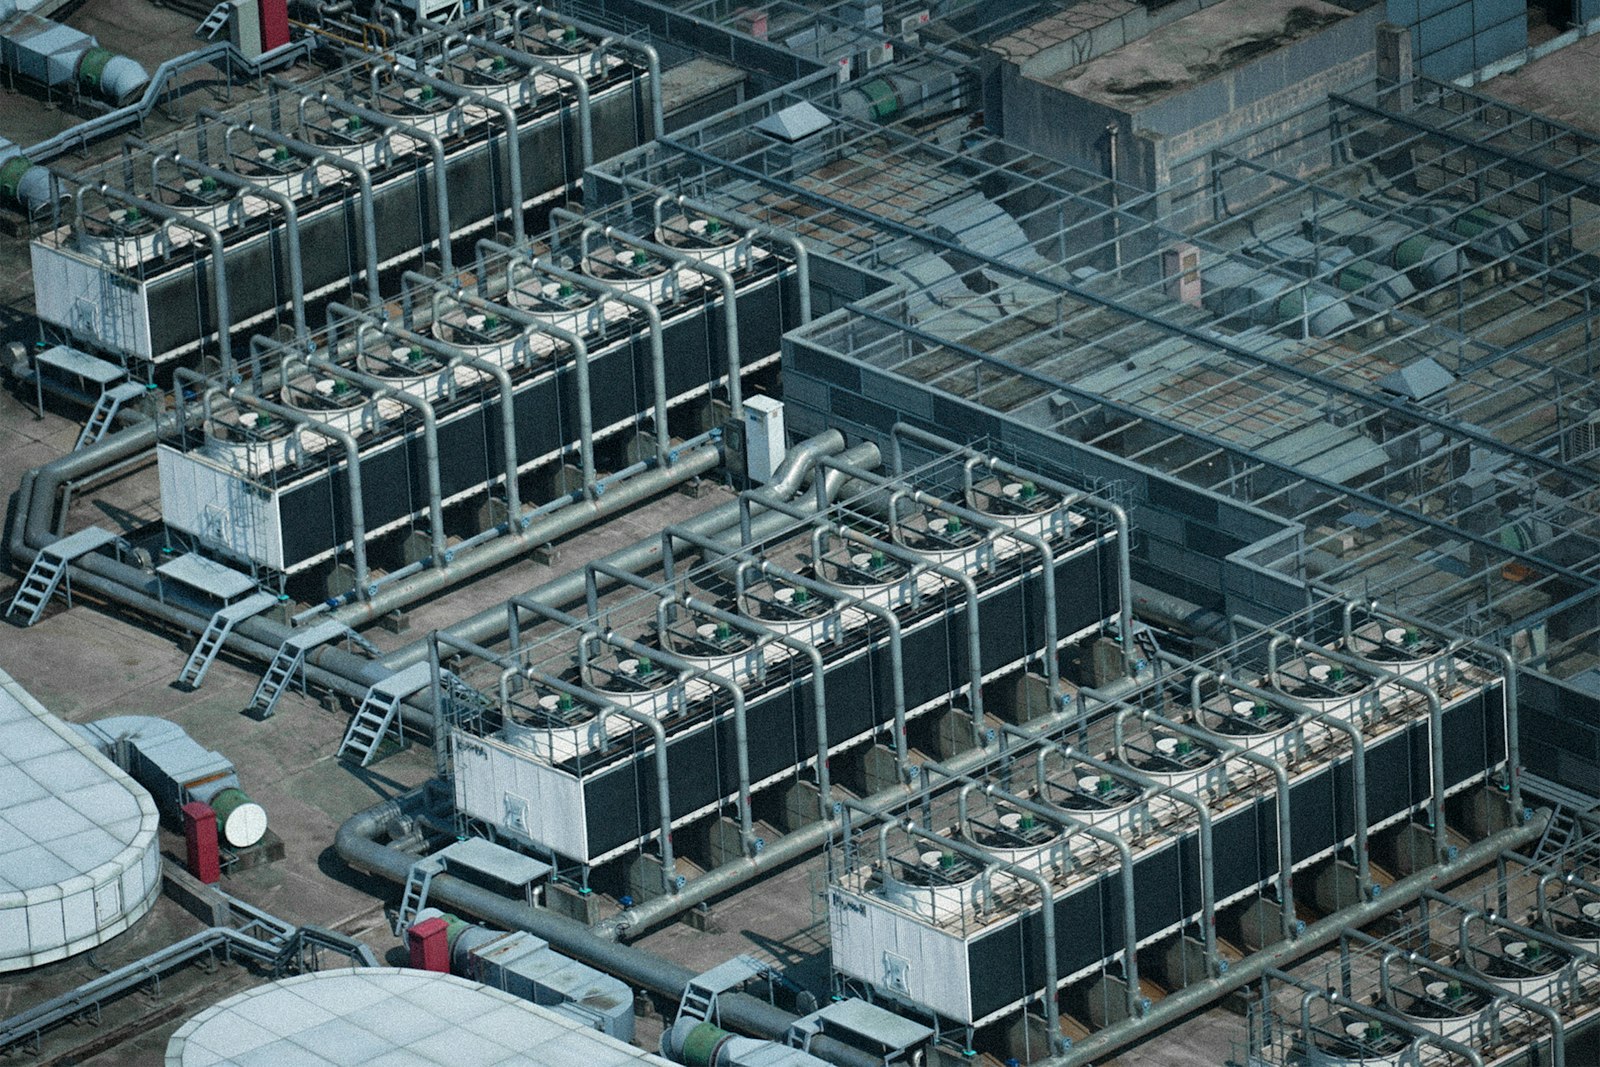
Watch demand climb before the interval closes
- Live facility load
The electric twin shows facility load, peak demand and power factor as the morning builds.
- Feeder loading
Each feeder is shown against its rated capacity, so the loads driving the peak are named.
- Flexible loads known
Sub-metering shows which loads must run now and which can wait a few minutes.
Pre-cool, stagger and shed in a set order
- Pre-cool early
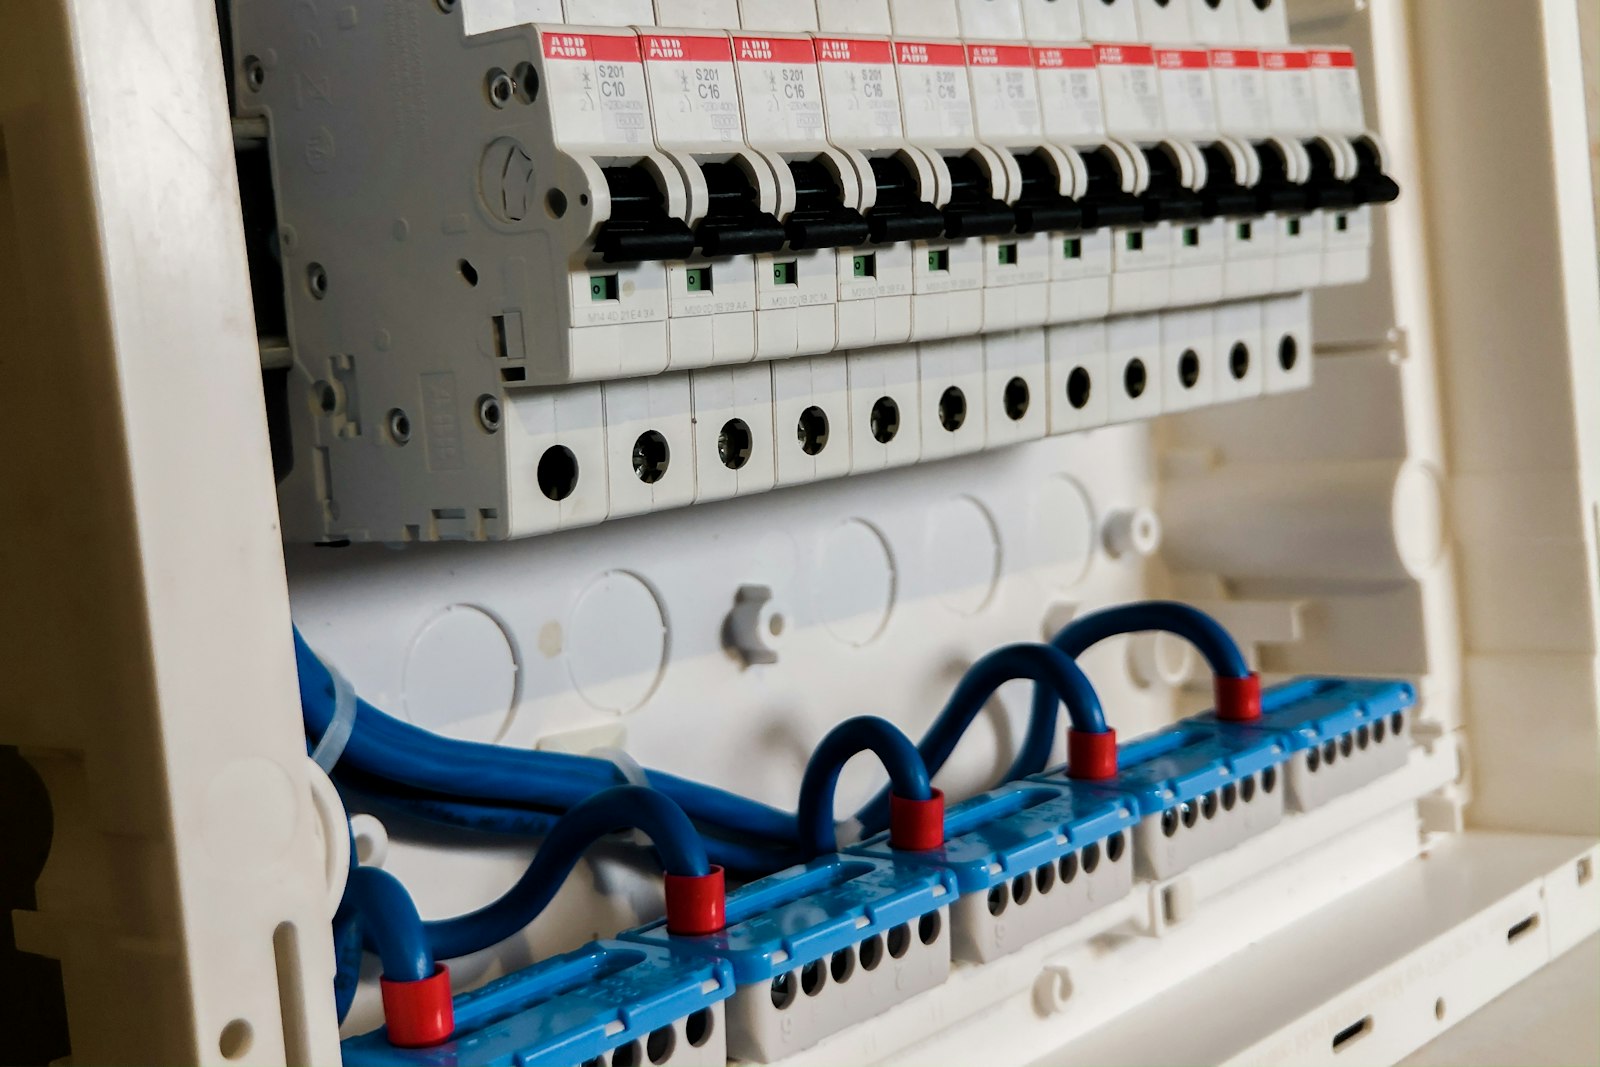
Office floors are cooled before the peak window, so chillers run less when demand charges bite.
- Stagger start-ups
Compressors, defrost cycles and process loads are sequenced so they do not all start together.
- Schedule other sources
Batteries, backup generation and solar can be planned against the curve where the site has them.
Every command logged, every interval verified
- Owner-approved rules
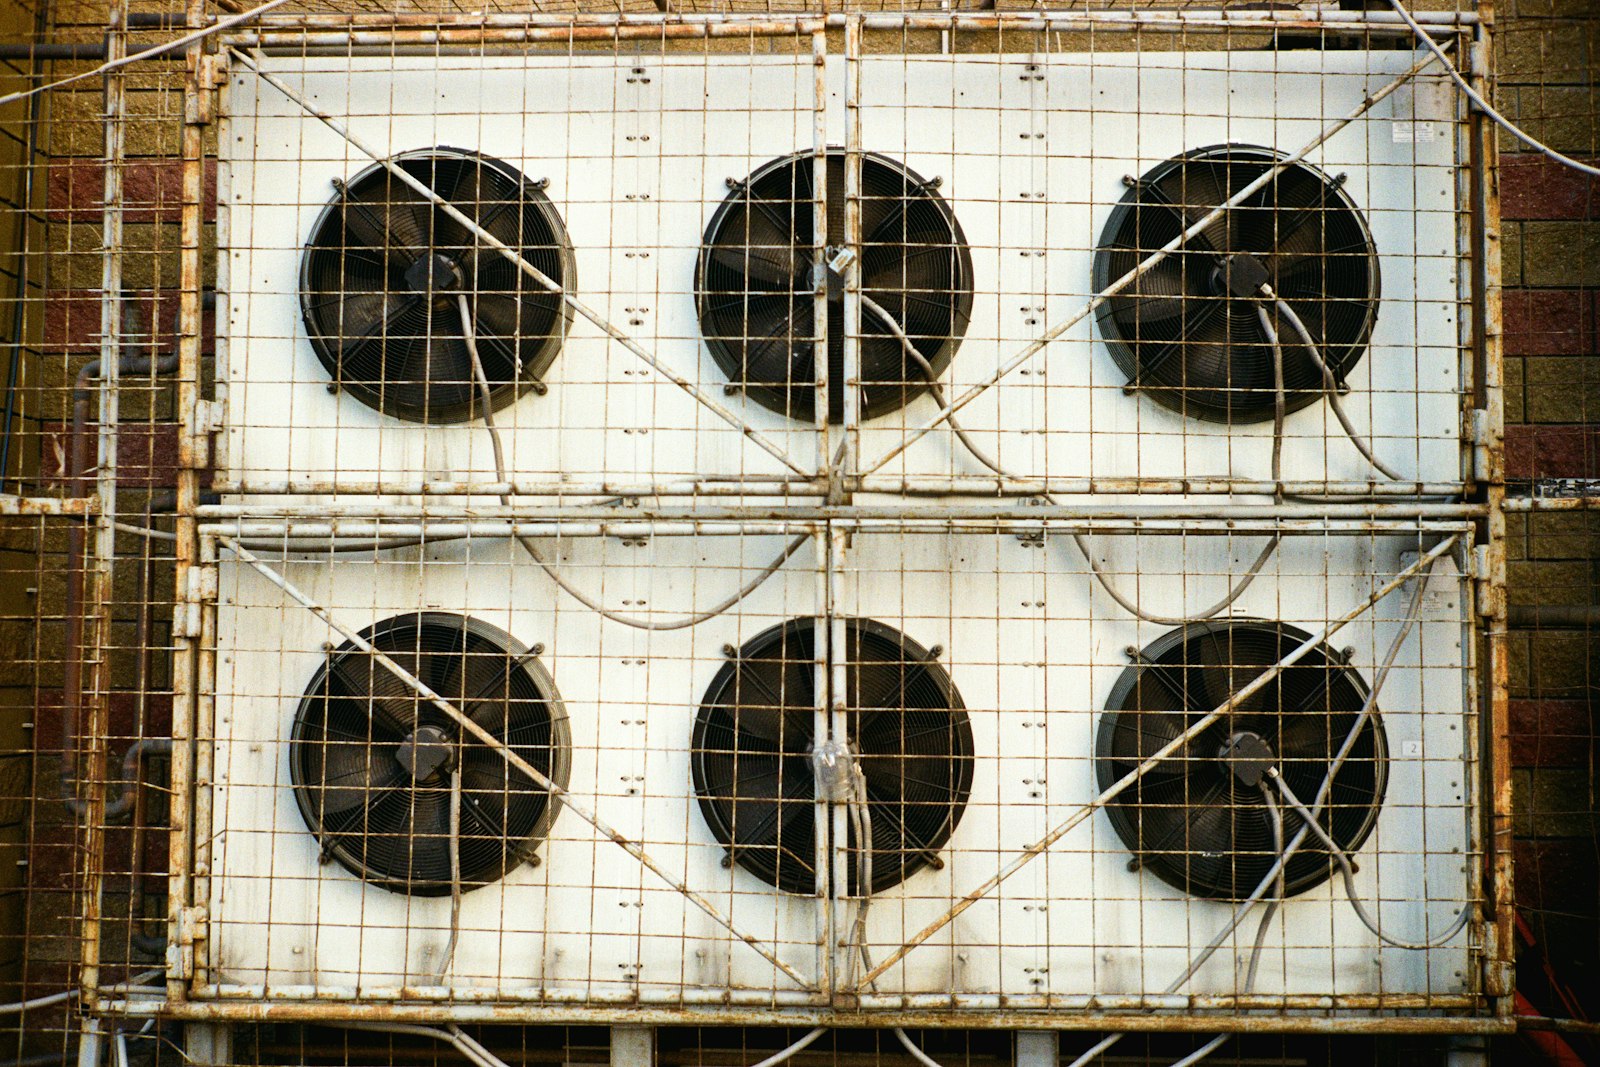
Where control is enabled, sequences run only under rules the owner has approved in advance.
- Relays and field devices
Simple loads switch through LoRaWAN relays. AHUs, RTUs and chillers are sequenced over Modbus or BACnet.
- Metered demand confirms
Metered peak demand for the interval shows whether the response held, with command history alongside.
Peak demand, before and after Aqueduct
- The demand charge arrives weeks after the interval that caused it.
- Chillers, refrigeration and lighting all start on one schedule.
- Nobody has a tested order for what to switch first.
- Poor power factor quietly adds cost every month.
- Nobody can show which action kept the peak down.
 The Aqueduct way
- Peak demand is visible live, as the interval builds.
- Start-ups are staggered so big loads never coincide.
- Owner-approved rules set the order: pre-cool, stagger, shed.
- The power triangle shows reactive waste on every node.
- Command history and metered demand prove what worked.
What peak demand looks like without Aqueduct
One bad interval can set the demand charge for the month.
Peaks seen on the bill
The demand charge arrives weeks after the interval that caused it.
Everything starts at once
Refrigeration, chillers, lighting and process loads all start together on a morning schedule.
No safe way to respond
Even when someone sees the peak, there is no tested sequence for what to switch and in what order.
Poor power factor adds cost
Out-of-phase current raises apparent power, so the site uses more infrastructure than it should.
How peak demand management works
Powered by aQ EnergySmart, with Smart Controls where control is enabled.
See load as it builds
The electric digital twin shows facility load, peak demand, power factor and feeder loading against rated capacity, with a demand curve per node.
Know which loads matter
Sub-metered feeders and equipment show which loads drive the peak and which can move.
Plan the response
Pre-cool before the peak, stagger start-ups, and shed or defer flexible loads. Backup generation, solar or batteries can be scheduled against the curve where the site has them.
Act through what is connected
Simple loads switch through LoRaWAN relays. AHUs, RTUs and chillers are sequenced over Modbus or BACnet through a field device controller. Lockouts prevent short cycling.
Log and verify
Command history shows each action and whether it executed. Metered demand confirms the peak stayed under the target.
One peak, managed
An illustrative day at a cold storage site.
Facility load and feeder data stream into the electric twin through the morning.
Demand is tracking toward the site's monthly peak earlier than usual on a hot day.
Refrigeration defrost and a second compressor are due to start in the same interval.
Under an owner-approved rule, the second start is staggered and the office floors are pre-cooled earlier. Each command is logged.
Metered demand stays below the target for the interval, and the command history shows every step executed.
Problem, solution, impact
Demand charges set by a single interval.
Live demand with load sequencing on connected equipment.
Peaks held under the target, verified in metered demand.
Ad hoc responses that risk equipment.
Tested sequences with lockouts and command history.
Equipment protected from short cycling while loads move.
Load shedding that hurts comfort.
Comfort compliance tracked during each response.
Demand reduced without breaking comfort targets.
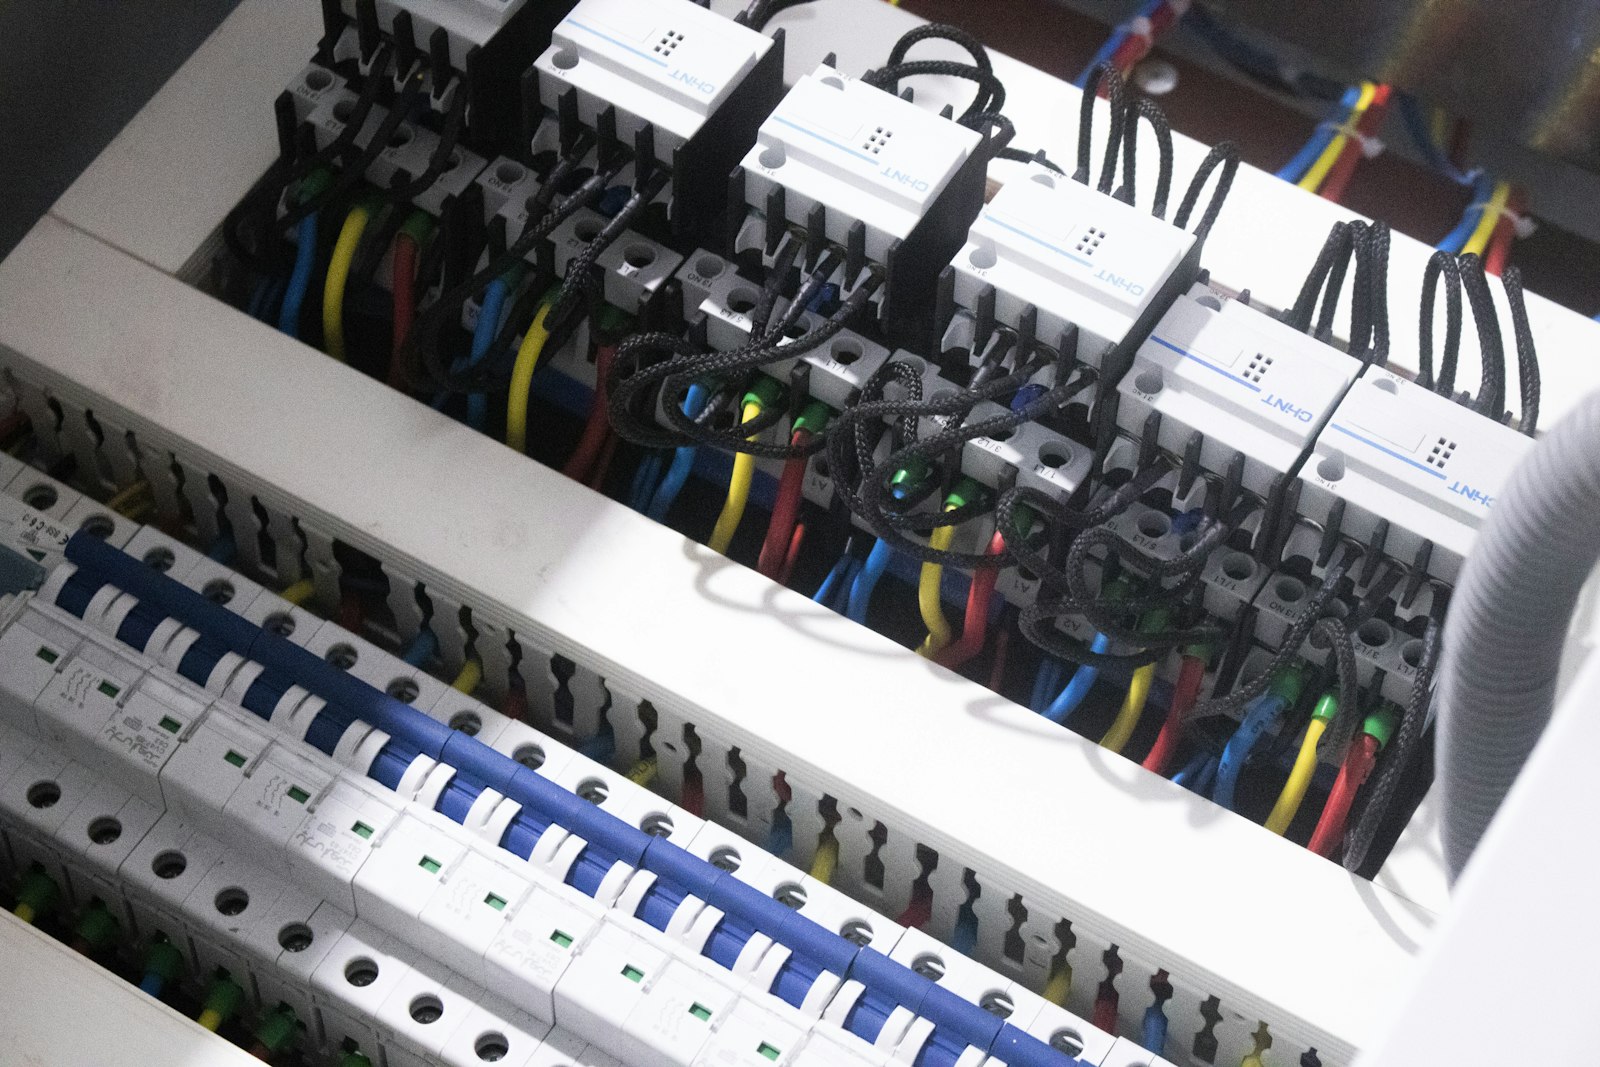
What you get
Live peak view
Facility load, peak demand and power factor on the electric twin.
Feeder loading
Each feeder against its rated capacity.
Load sequencing
Pre-cool, stagger and shed, where control is enabled.
Power factor visibility
The power triangle per node, so reactive waste is seen.
Command history
Every command, and whether it executed.
Verified demand
The metered peak confirms the result.
Where it fits
- EMS
- BEMS demand features
- BAS sequences and schedules
- CMMS
- Historians
Control is used only where enabled and with owner approval. DERMS and grid control are not in scope.
Related standards and programs
Check the current rule and your tariff.
Where teams put it to work
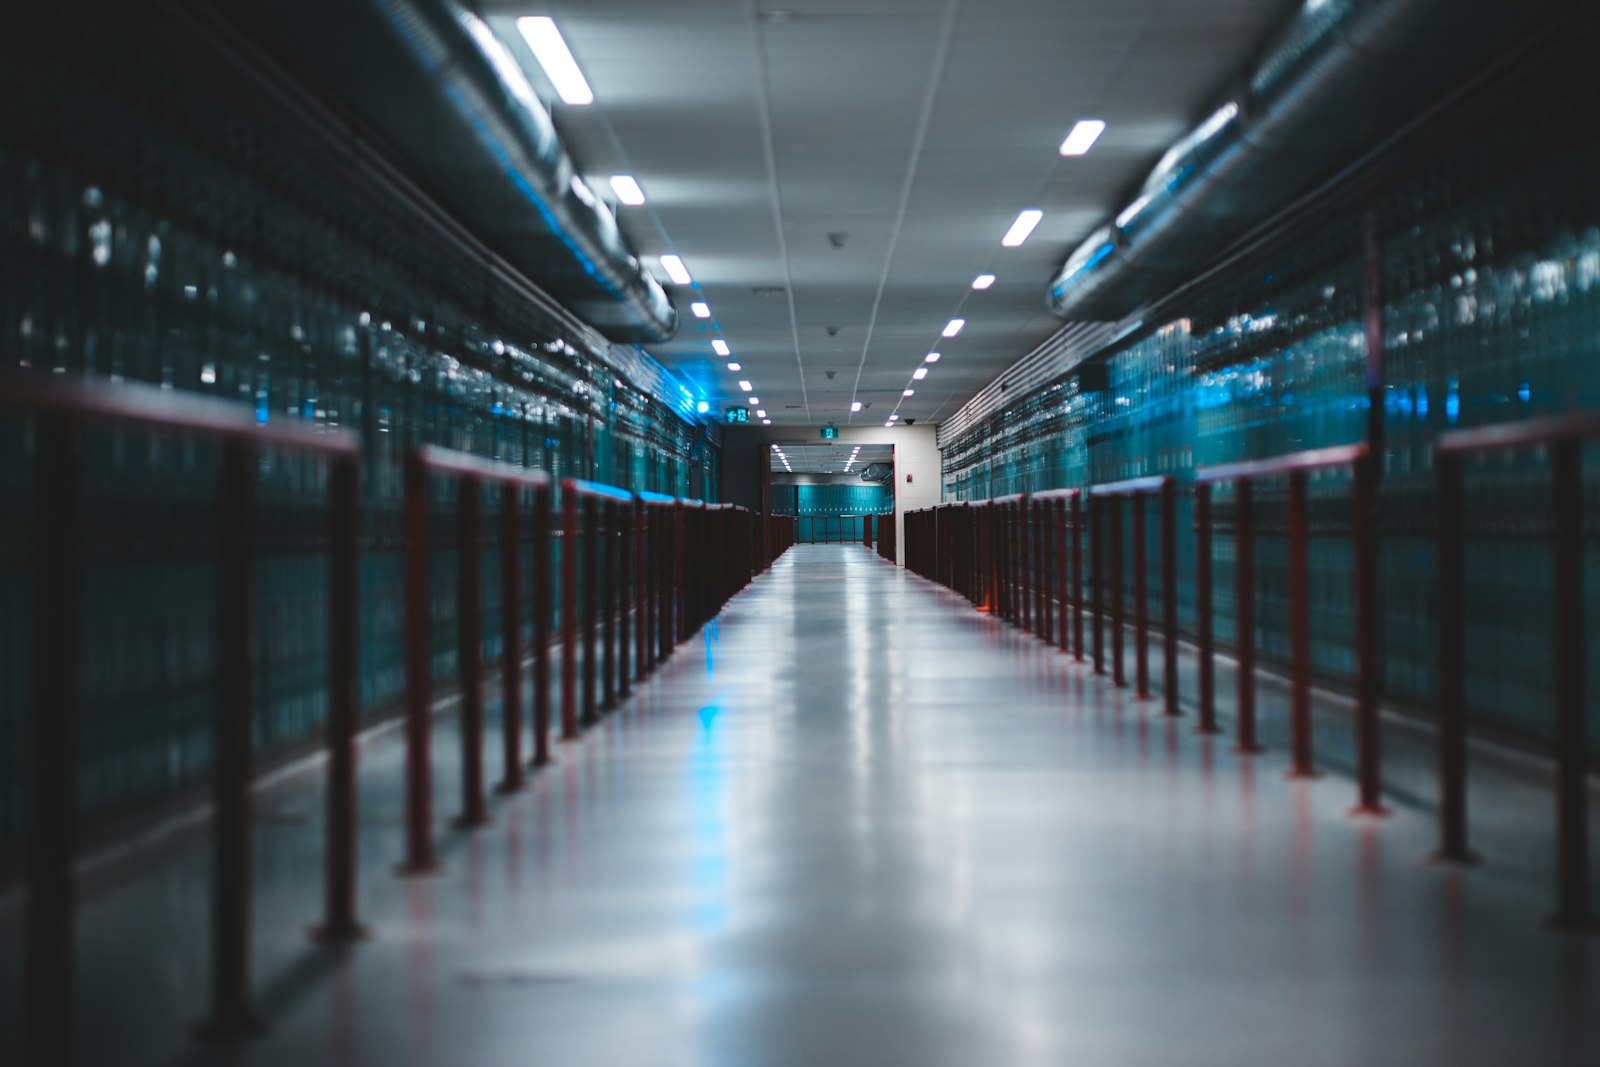
Cooling sequenced around the critical load
IT load stays untouched while cooling plant start-ups are staggered and pre-cooling is scheduled where control is enabled.
Learn more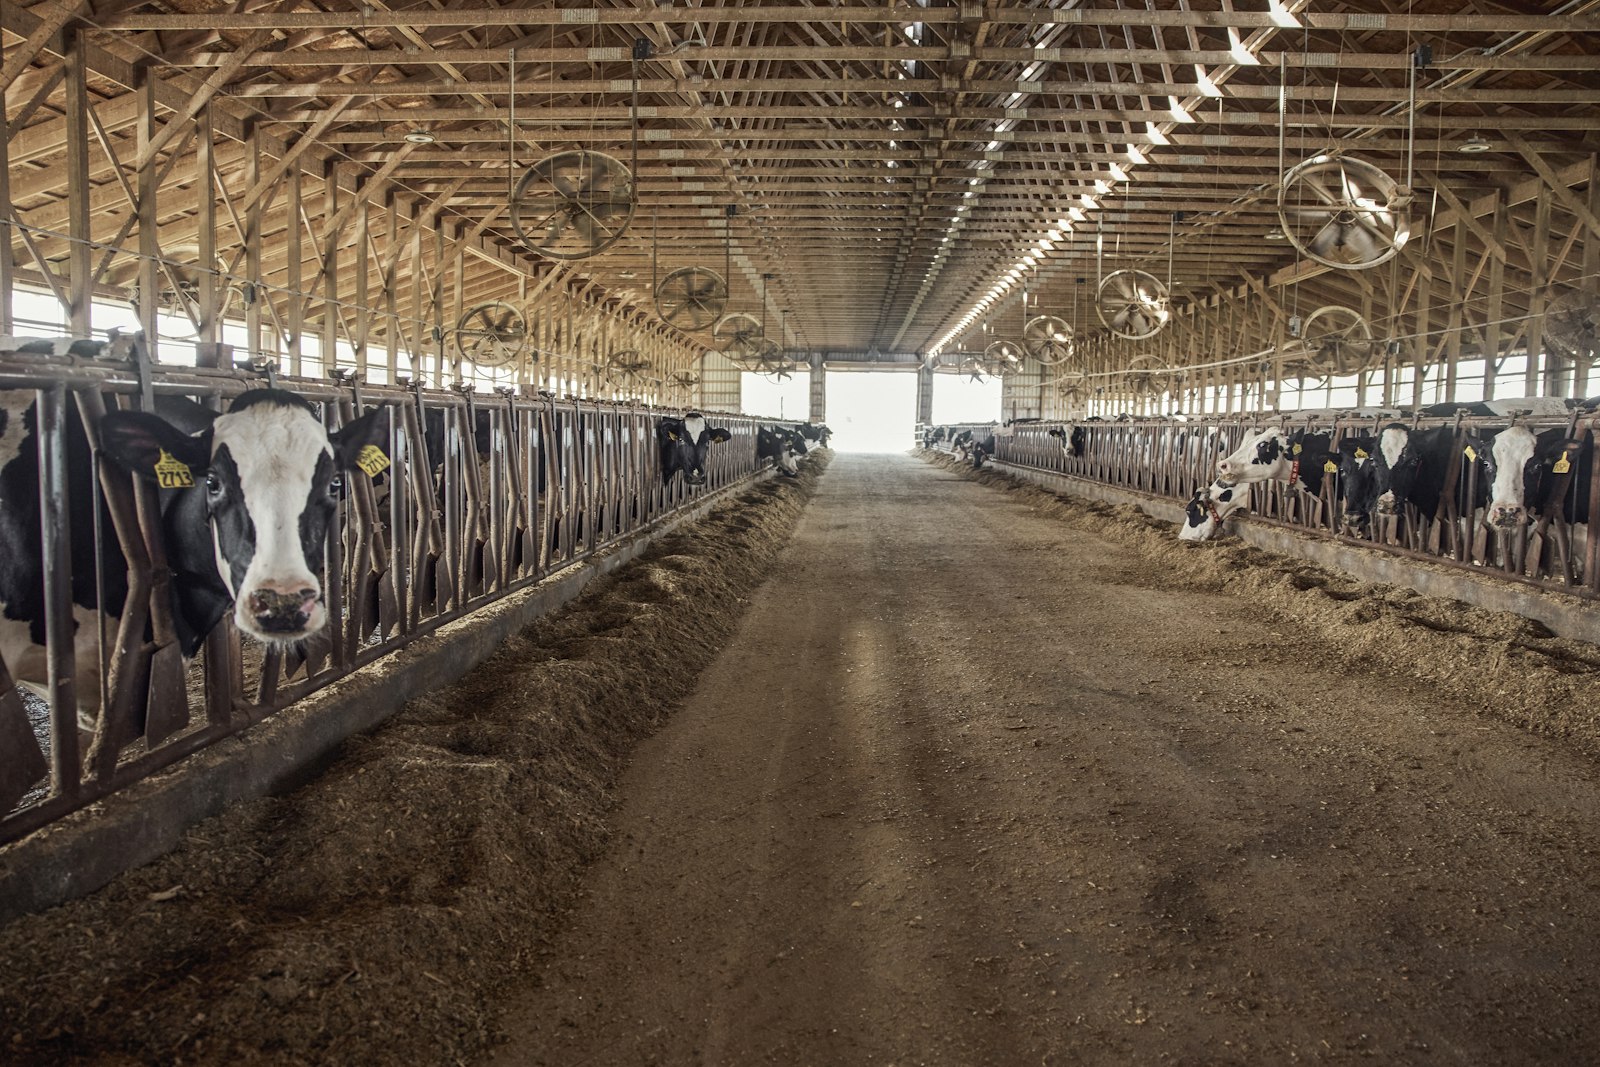
Refrigeration that does not stack up
Compressor starts, defrost cycles and processing loads are sequenced so they do not land in the same interval. Major dairy operations run on Aqueduct.
Learn more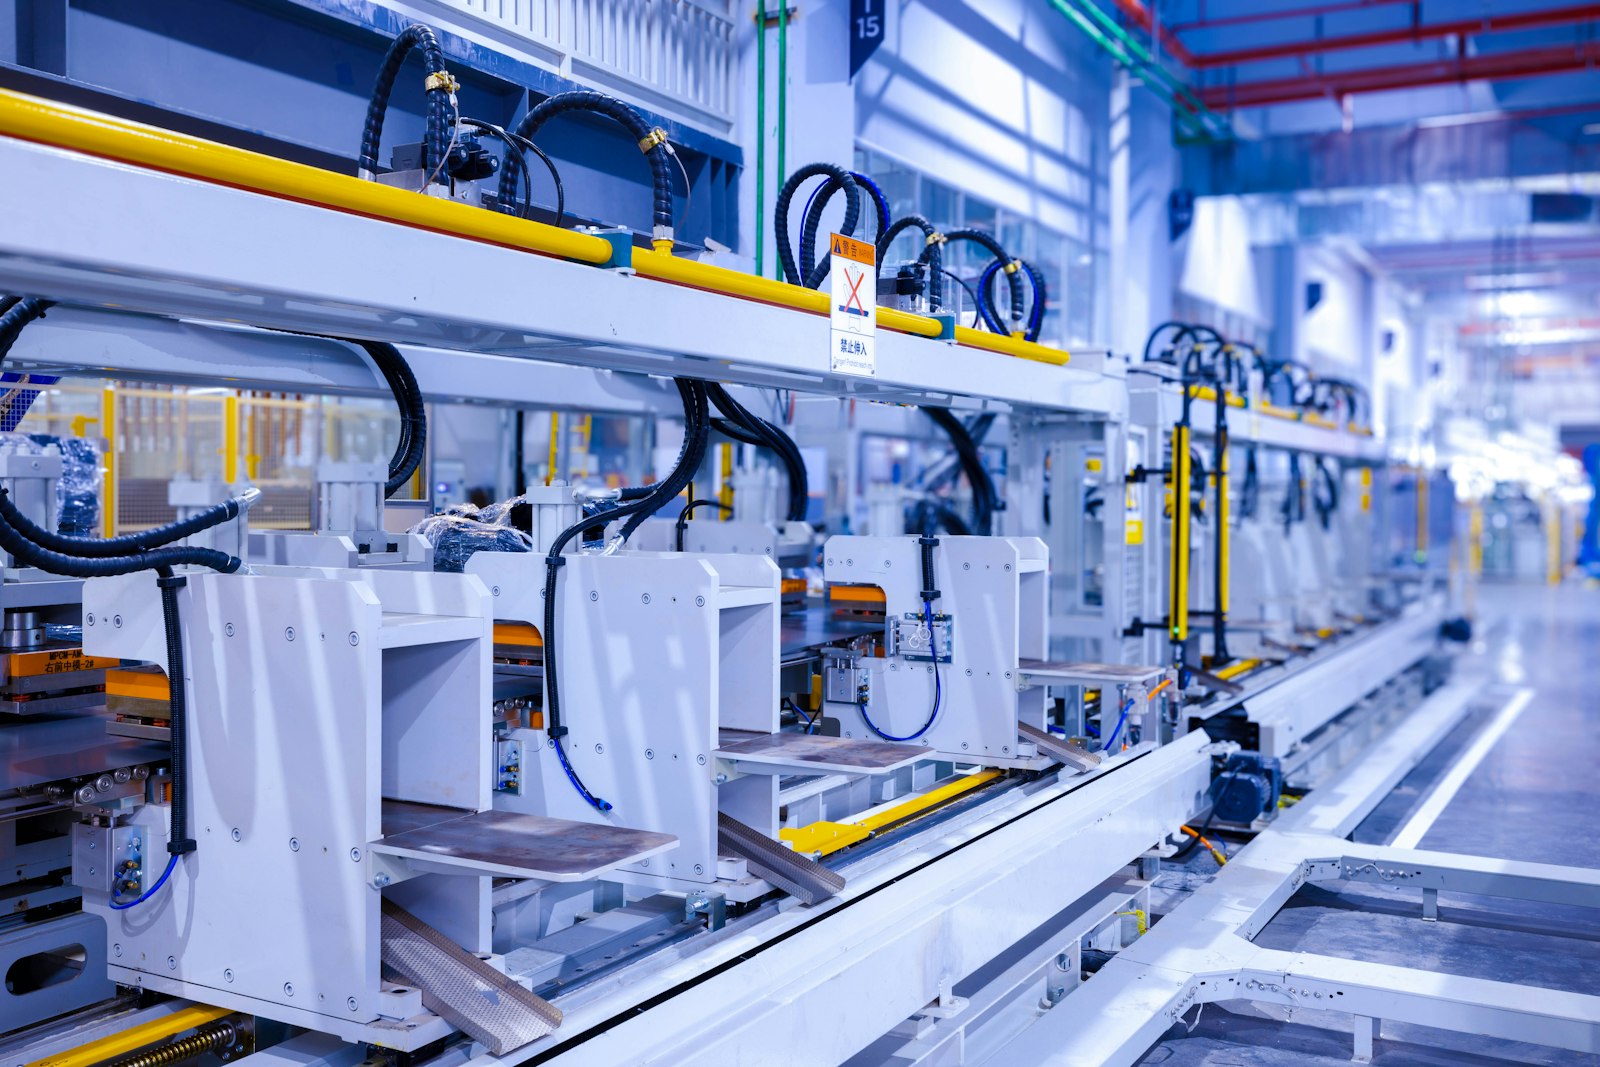
Shift start without the spike
Line start-ups, compressed air and HVAC are staggered at shift change, so production starts on time without a new monthly peak.
Learn moreRelated
Common questions
It is keeping a facility's highest interval of power draw below the level that triggers higher demand charges or a higher tariff band.
Only where control is enabled and the owner has approved the rules. Every command is recorded in command history.
Two ways: LoRaWAN relay switches for simple loads, and Modbus or BACnet through a field device controller for AHUs, RTUs, chillers and VAV boxes.
Comfort compliance and setpoint attainment are tracked during each response, so the trade-off is visible and rules can be tuned.
See Aqueduct on your own facility.
Bring a site, a utility bill or a question. We will show you where the loss is.