Facility management use cases, from the first signal to the verified fix
Facility management use cases are specific problems Aqueduct resolves end to end. Each one runs the same loop: monitor with meters and sensors, measure against a baseline, identify the cause, act through your CMMS or controls where enabled with owner approval, and verify the result at the meter. Twelve use cases cover water, energy, air and operations.

Twelve problems, one loop: monitor, measure, identify, act, verify.
Water and energy loss located, priced and fixed
- Water balance
Supply equals use plus loss, so unaccounted flow is the leak signal on every line.
- HVAC and demand
HVAC baselined against weather, with peak kW tracked as it builds through the day.
- Controls with approval
Schedules and setpoints adjusted where control is enabled, with every command logged.
Air held in range and equipment kept running
- Air health
CO2, particulates and VOC tracked by zone, with exposure measured in zone-hours.
- Faults fixed
Faults diagnosed in plain language, routed to your CMMS and confirmed closed.
- Failures prevented
Rising vibration, a new sound signature and energy drift schedule maintenance before the equipment fails.
Billing, benchmarking and reporting from metered data
- Bill validation
Billed consumption is compared with metered consumption every cycle, with rate changes separated from usage changes.
- Tenant billing
Bills generated per tenant from dedicated and shared meters, with anomalies flagged.
- Reporting evidence
Metered water, energy and carbon data for the reports your team or consultant files.

Facility problems, before and after Aqueduct
- Each problem gets its own vendor, its own sensor and its own login.
- Problems surface on the bill or in a complaint.
- Root cause is a guess made on a site walk.
- Fixes are closed on the ticket, not confirmed on the meter.
- Every new use case starts a new project from zero.
 The Aqueduct way
- Every use case runs on one data layer, aQ Core.
- Problems surface from live data, refreshed every 60 seconds.
- Root cause is explained in plain language with a location.
- The meter confirms the fix before anything counts as closed.
- New use cases reuse the meters and data already connected.
How to reduce water loss in buildings and campuses, then prove it stopped
Reducing water loss in buildings means finding water that enters but is never used, then stopping it.
Read more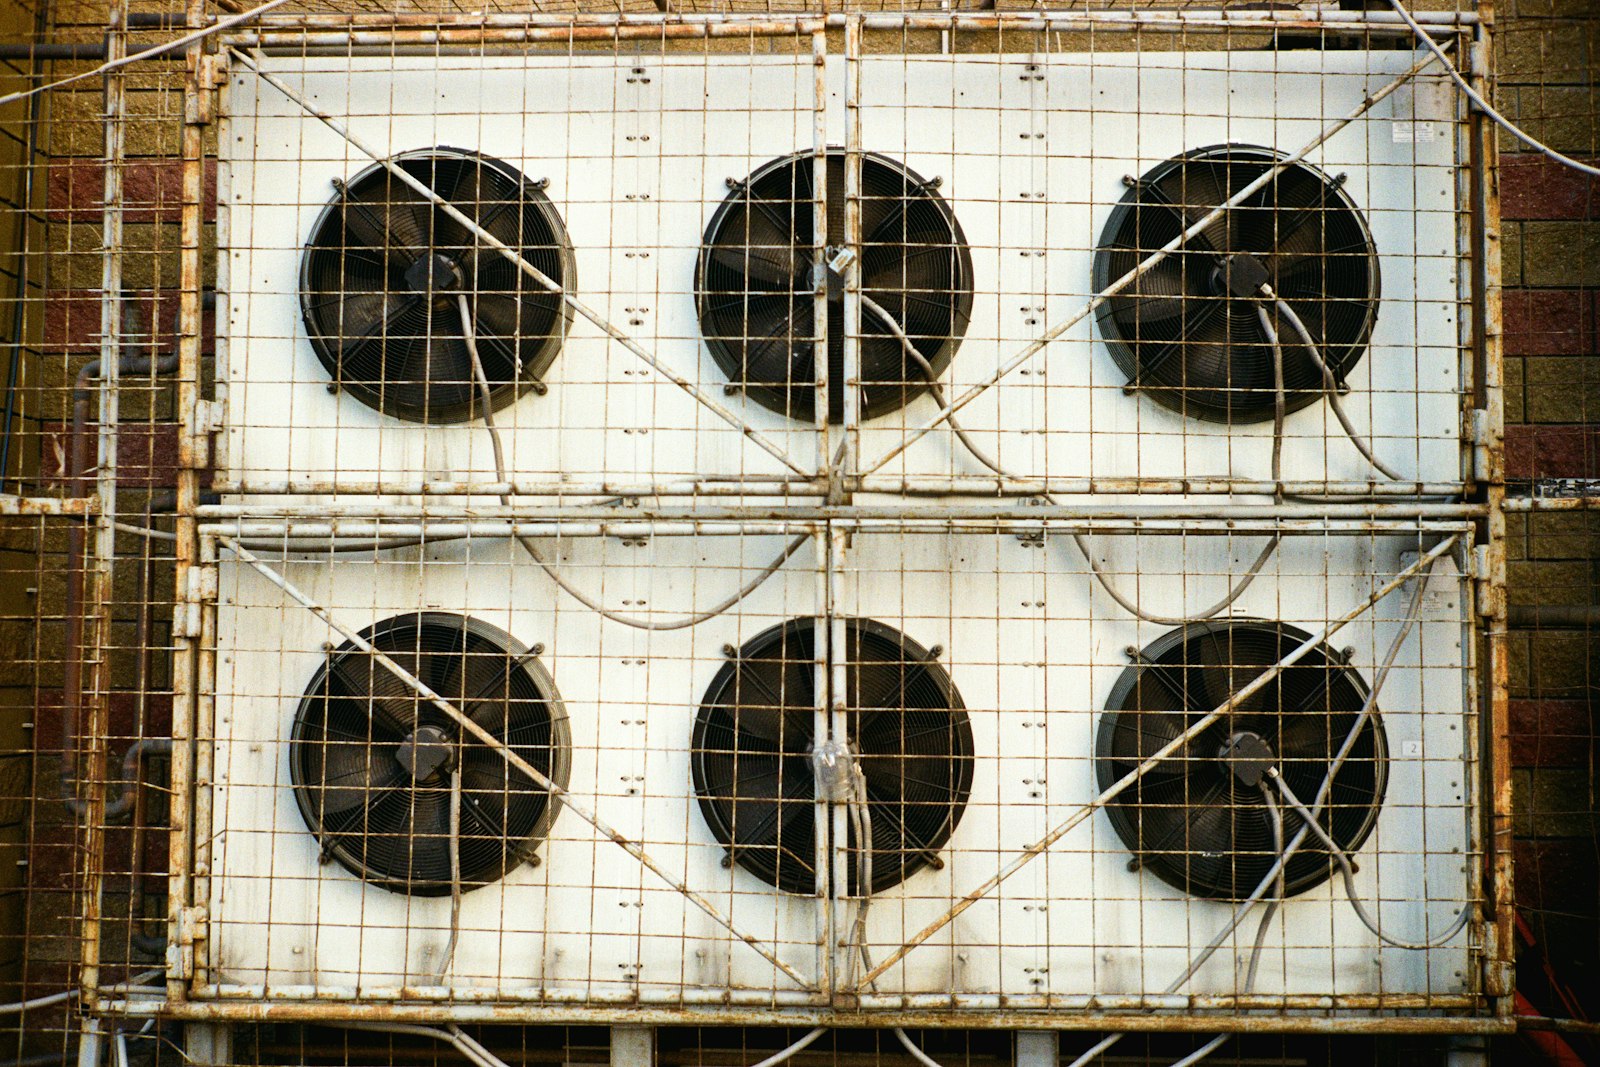
HVAC energy optimization, baselined against weather and verified at the meter
HVAC energy optimization reduces the energy heating, cooling and ventilation use without losing comfort.
Read more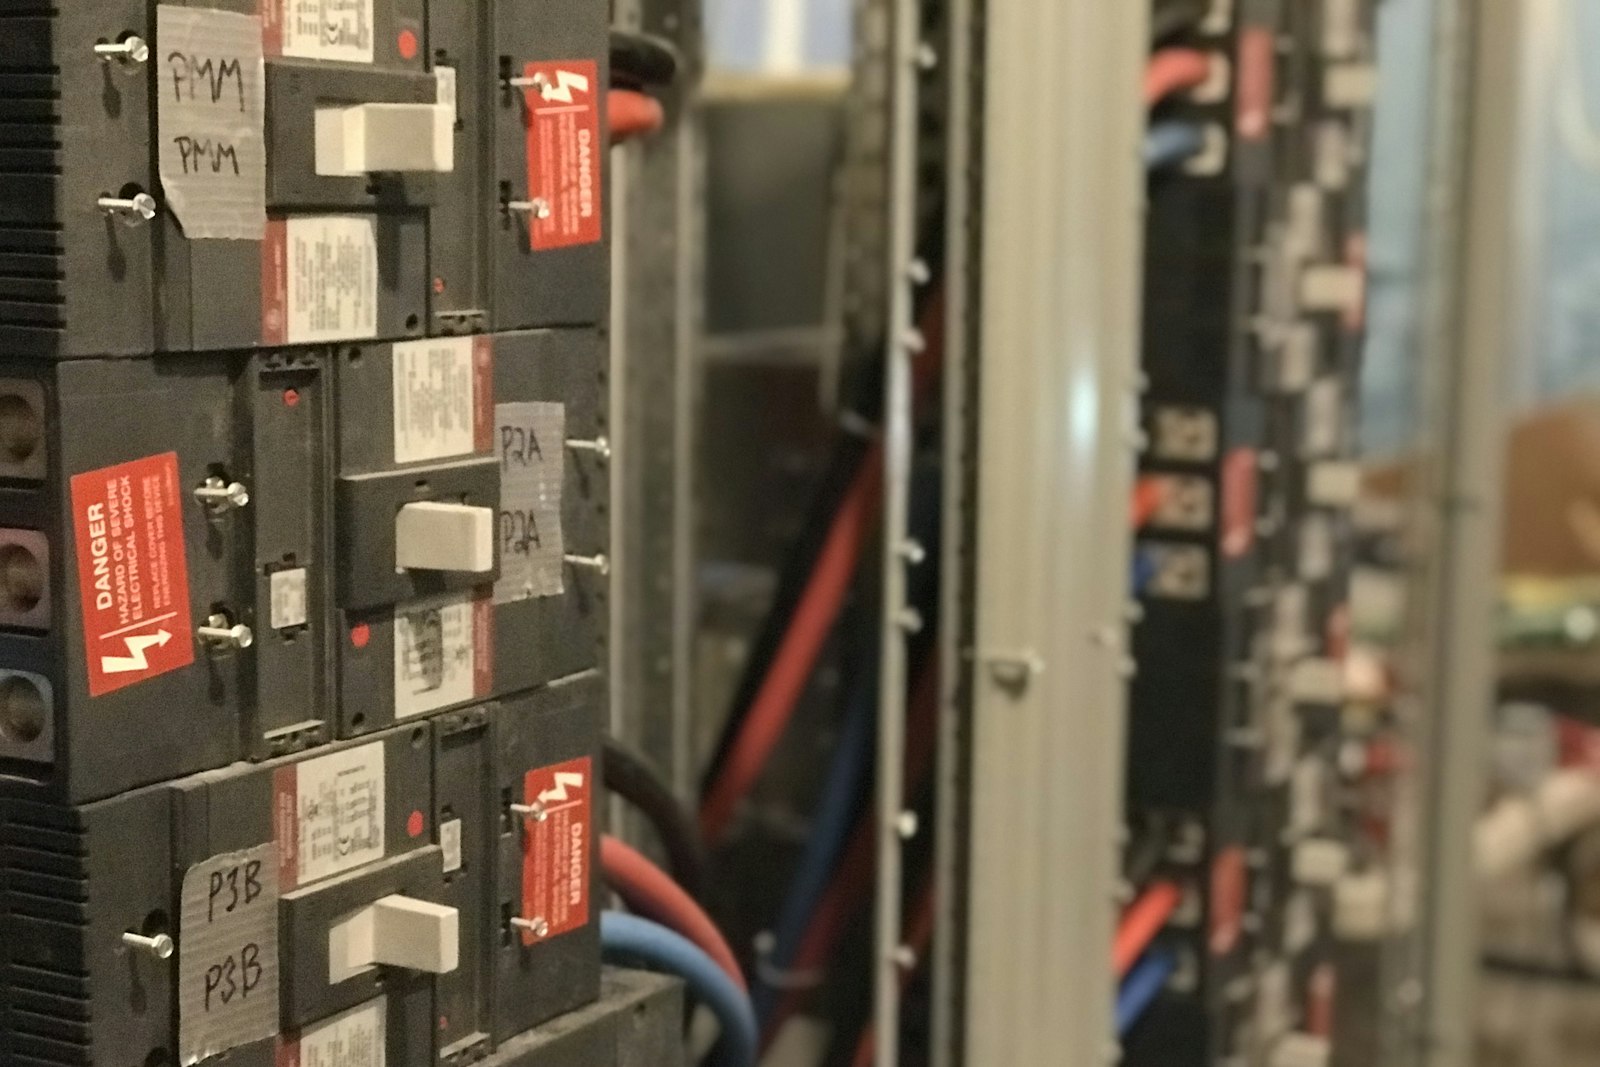
How to reduce peak demand charges and stay inside your tariff band
Reducing peak demand charges means keeping the highest interval of electricity use below the level your tariff penalizes.
Read more
Utility bill validation, billed consumption checked against your own meters
Utility bill validation compares what a utility charges with what was actually consumed.
Read more
Indoor air quality compliance monitoring, with the evidence to show it
Indoor air quality compliance monitoring measures air in occupied spaces against the standards a building follows.
Read more
A smart restroom monitoring system for running toilets and cleaning on demand
A smart restroom monitoring system measures restroom conditions so teams clean and repair on real need.
Read more
Tenant submetering and billing software that bills from the meter, not the floor plan
Tenant submetering and billing software charges each tenant for the utilities they actually use.
Read more
Occupancy based HVAC control that follows real use, with every command on record
Occupancy based HVAC control runs heating, cooling and ventilation to whether a space is actually in use.
Read more
Reduce equipment downtime in facilities with faults fixed and failures prevented
Reducing equipment downtime in facilities means fixing faults fast and stopping failures before they happen.
Read more
ESG data for building sustainability reporting, measured at the meter
ESG data for building sustainability reporting is the measured water, energy, carbon and air information that reports depend on.
Read more
STP and RO plant monitoring software for measured water reuse
STP and RO plant monitoring software tracks how well on-site treatment plants perform.
Read more
Building portfolio energy benchmarking that ranks sites and drives action
Building portfolio energy benchmarking compares sites on a fair basis to find the ones that waste most.
Read moreUse cases that find and stop loss
Water, energy and controls problems that cost money every hour they run.
Reduce water loss
Close a live water balance, find unaccounted flow, locate it to the line and confirm the fix at the meter.
Learn moreWater reuse, STP and RO
Track treatment plant efficiency, RO recovery and reuse flow so recycled water is measured, not assumed.
Learn moreRestroom monitoring
Odor, sound levels, occupancy and water use combined to flag running toilets and cleaning needs, without recording audio.
Learn moreHVAC energy optimization
Baseline HVAC against weather, find the waste, adjust where control is enabled and verify the saving.
Learn moreOccupancy-based HVAC control
Run equipment to real occupancy from sensors or schedules, with every command logged and audited.
Learn morePeak demand and tariffs
See peak kW as it builds, sequence loads to stay under your demand band and track power factor.
Learn moreUse cases that protect people, assets and the numbers
Air, uptime, billing and reporting problems where the proof matters as much as the fix.
Indoor air quality compliance
CO2, PM2.5, VOC and exposure in zone-hours, with the measured evidence your standards ask for.
Learn moreEquipment uptime
Faults diagnosed and routed to your CMMS, early signs of failure caught and device health tracked.
Learn moreUtility bill validation
Compare what the utility billed with what your meters measured, and split usage changes from rate changes.
Learn moreTenant submetering and billing
Tenants, meters per tenant and anomalies per tenant, with bills generated from metered data.
Learn moreESG and sustainability reporting
Metered water, energy, carbon and air data for the reports and certifications your team files.
Learn morePortfolio benchmarking
Rank sites on normalized intensity and performance against baseline, then act on the outliers first.
Learn more
Use cases at a glance
What each one needs on site and who usually asks for it.
| Use case | Outcome | Needs on site | Asked for by |
|---|---|---|---|
| Reduce water loss | Water | Main and sub-meters on floors and lines | Facilities, finance |
| Water reuse, STP and RO | Water | Flow, level and quality sensors at the plant | Engineering, sustainability |
| Restroom monitoring | Water and air | Restroom air sensor, PIR, sink or line meters | Facilities, operations |
| HVAC energy optimization | Energy | HVAC sub-meters, BMS points, controllers | Engineering, facilities |
| Occupancy-based HVAC control | Energy | PIR or schedules, relays or field controllers | Engineering, operations |
| Peak demand and tariffs | Energy | Power meters at the main and feeders | Finance, engineering |
| Indoor air quality compliance | Air | CO2, PM, VOC sensors by zone | Facilities, sustainability |
| Equipment uptime | Operations | BMS points, power meters, vibration sensors | Operations, engineering |
| Utility bill validation | Energy and water | Main meters plus 6 to 12 months of bills | Finance |
| Tenant submetering and billing | Operations | Dedicated or shared tenant meters | Real estate, finance |
| ESG and sustainability reporting | Platform | Main meters, sub-meters, air sensors | Sustainability, CEO |
| Portfolio benchmarking | Platform | Main meters per site, floor areas, visitors | Real estate, CEO |
The loop every use case runs
The same five steps sit behind every page in this section.
Meters, sensors and building system points report into aQ Core, existing or newly specified through partners.
A baseline is set per site, line, zone or asset, weather-normalized where weather drives use.
Loss, faults and breaches are found and explained in plain language, with a location and a cost.
A ticket routes into your CMMS, or setpoints and schedules change where control is enabled with owner approval.
The meter confirms the result, and the verified reading becomes the new baseline.
Where teams put it to work
Leak loss found from the balance
Unaccounted flow on a live water balance points to the line losing water, prices it and confirms the repair at the meter.
Learn more
Running toilets flagged without audio
Sound levels, odor, occupancy and water use combine to flag running fixtures and cleaning needs while preserving privacy.
Learn more
Bills checked against your own meters
Billed consumption is compared with metered consumption every cycle, and rate changes are separated from usage changes by site.
Learn moresites in 21 countries run on Aqueduct.
and 9 clinics in one of India’s top hospital chains.
US airport running water intelligence on Aqueduct.
of commercial real estate under Aqueduct.
FMCG manufacturing campus.
operations run on Aqueduct.


Related
Common questions
The most common are reducing water loss, HVAC energy optimization, peak demand management, utility bill validation, indoor air quality, equipment uptime, tenant billing and sustainability reporting. Aqueduct covers all of them on one data layer so the same meters serve several use cases.
Start where the money or the risk is clearest. Many sites begin with water loss or utility bill validation because uploading 6 to 12 months of bills gives Aqueduct a day-one baseline, then add HVAC, air and uptime on the same platform.
Yes. A restroom air sensor reports odor, sound, occupancy and VOC, which serve restroom monitoring, air quality and cleaning schedules. A power meter serves peak demand, bill validation and HVAC optimization. Aqueduct reads every point once and reuses it.
No. Most use cases start with monitoring, measuring and routing tickets into your CMMS. Control is added only where it is enabled, with owner approval, through LoRaWAN relays or field device controllers over Modbus or BACnet.
Every use case ends with verification at the meter. The reading after the fix is compared with the baseline, and the verified result becomes the new baseline, so savings are measured rather than estimated.
Savings are verified at the meter against a weather-normalized baseline. Results vary by site, starting point and what the team acts on.
Yes. All use cases sit on aQ Core, so adding one usually means adding a few meters or sensors and turning on the views. Data you already collect is reused.
See Aqueduct on your own facility.
Bring a site, a utility bill or a question. We will show you where the loss is.