
Portfolios ranked by waste, and fixed building by building.
Offices, mixed-use and retail on one platform. Aqueduct ranks the portfolio by intensity and cost, acts on the worst buildings first, and verifies every saving at the meter.
Rank every building by waste, fix the worst first, and verify each saving.
The whole portfolio ranked by intensity and cost
- Every asset, one view
Offices, mixed-use and retail sit on one platform, whatever BMS each building runs today.
- Worst buildings first
Buildings are ranked against their own weather-normalized baselines, so capital and crews go where waste is highest.
- Proven at scale
Live across a commercial real estate client's 20M+ sq ft portfolio, building by building.

Performance standard targets tracked all year, not at filing
- Weather-normalized intensity
Energy use intensity per building is tracked against weather, so drift toward a penalty shows up early.
- Bills on day one
Upload 6 to 12 months of utility bills and the baseline is ready without waiting a season.
- Metrics for filings
Verified monthly metrics export for benchmarking and certification filings, while your team keeps filing them.

Common-area and tenant use reconciled to the main meter
- Sub-meters reconciled
Tenant and common-area sub-meters reconcile to the main, so leaks show up in the balance.
- Air tenants can see
Zone CO2 and particulate records support fit-outs, lease conversations and certifications, floor by floor.
- Bills checked
Utility bills are validated against metered use, so billing errors are caught before they are paid.

Managing a CRE portfolio, before and after Aqueduct
- Building performance is known once a year, at filing time.
- Every building runs a different BMS with a different login.
- Capital goes to the building with the loudest manager.
- Tenant water is split by floor area, not by use.
- Savings are reported as estimates from the original proposal.
 The Aqueduct way
- Building performance is tracked against target every month of the year.
- One platform covers every building, whatever BMS it runs.
- Capital goes to the buildings ranked highest for waste.
- Tenant water rests on reconciled sub-meter data.
- Savings are verified at the meter and stated in money.
What commercial real estate teams are up against.
Water, energy, air and operations carry equal weight. Each one runs the same loop: monitor, measure, identify, act, verify.
Water: Common-area and tenant water, reconciled
Sub-meters reconcile to the main. Leaks found from the balance.
Energy: Performance standards, with evidence
Weather-normalized EUI per building, so performance-standard targets are tracked all year, not at filing time.
Air: Air tenants can see
Zone records for fit-outs and certifications.
Operations: One platform across owners and managers
The same faults, tickets and verified closures across every building, whatever BMS each one has.
Problem, solution, impact.
How Aqueduct resolves each problem for commercial real estate, and what changes when it does.
Sub-meters reconcile to the main. Leaks found from the balance.
A live water balance across meters and sub-meters localizes the loss, routes the fix and confirms it closed at the meter.
Loss found from the balance, not the bill, and every fix verified.
Weather-normalized EUI per building, so performance-standard targets are tracked all year, not at filing time.
Weather-normalized baselines per building and asset show the waste in money; schedules and setpoints adjust where control is enabled.
Savings stated in money and confirmed at the meter, not estimated.
Zone records for fit-outs and certifications.
Air quality per zone, overlaid with occupancy, with ventilation raised when it matters and verified back in range.
Targets held during occupied hours, with the energy cost counted.
The same faults, tickets and verified closures across every building, whatever BMS each one has.
Faults diagnosed in plain language and routed into your CMMS with the fix; early signs of failure schedule maintenance first.
Fewer reactive call-outs and closures confirmed by the equipment.
One incident, from first signal to verified fix.
An illustrative example of the flywheel on a typical site.
Meters, BMS points and tenant sub-meters across the portfolio.
Weather-normalized baseline and EUI per building.
Tower 3 chiller plant drifting 3.8% from baseline.
Schedule and setpoints adjusted where control is enabled. Ticket routed for the bearing.
Drift back to 0.2%. Saving booked against the building's target.
Four connected products on one data layer.

Replace what should be replaced. Connect the rest.
- BMS and BAS
- EMS and BEMS
- Tenant sub-metering analytics
- Water management
- CMMS
- IWMS and CAFM
- ENERGY STAR Portfolio Manager exports
Three equal ways in: keep your BMS, replace it, or build Aqueduct in at design stage.
The questions each seat asks first.
“Which buildings waste the most, and what is it worth?”
“Can it replace the BMS in the older towers?”
“Where do the benchmarking numbers come from?”
Standards and regulations we supply evidence for.
We supply the measured inputs. You run the program and file the report.
Where teams put it to work

Waste ranked across every asset
Every building ranked by intensity and cost against its own baseline, so asset plans start with evidence rather than anecdotes.
Learn more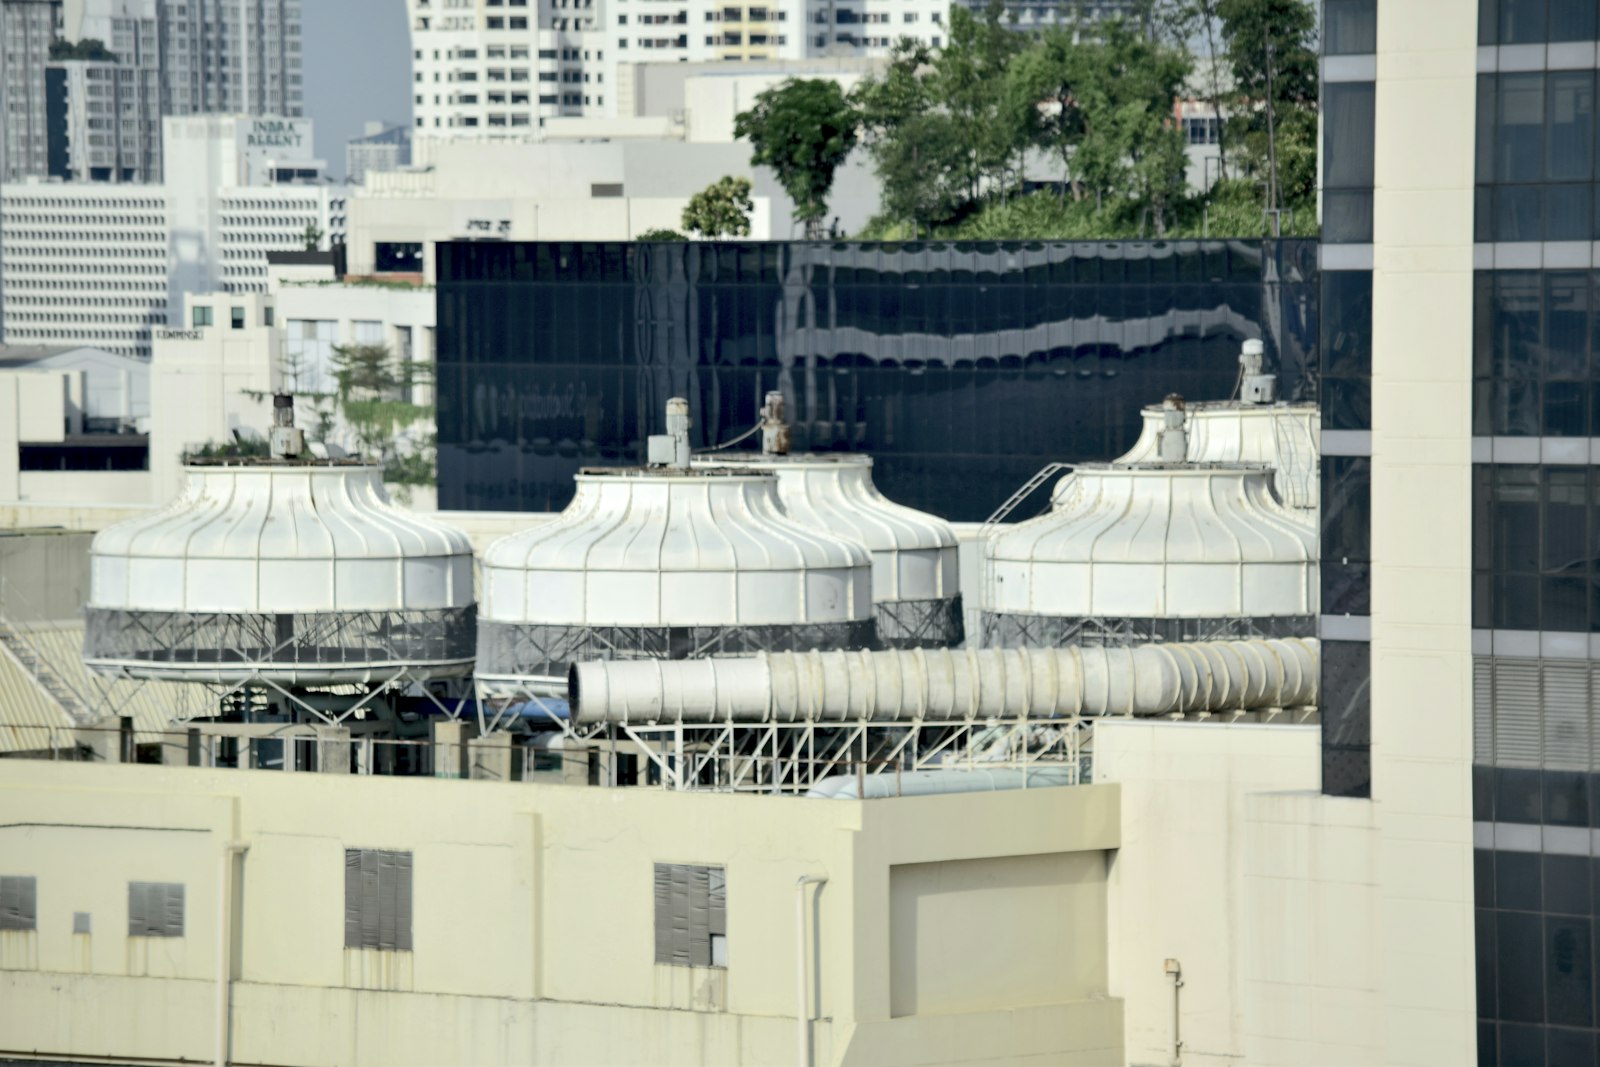
Faults fixed, whatever the BMS
Chiller drift, stuck dampers and schedule faults diagnosed and routed into your CMMS, then confirmed closed by the equipment.
Learn more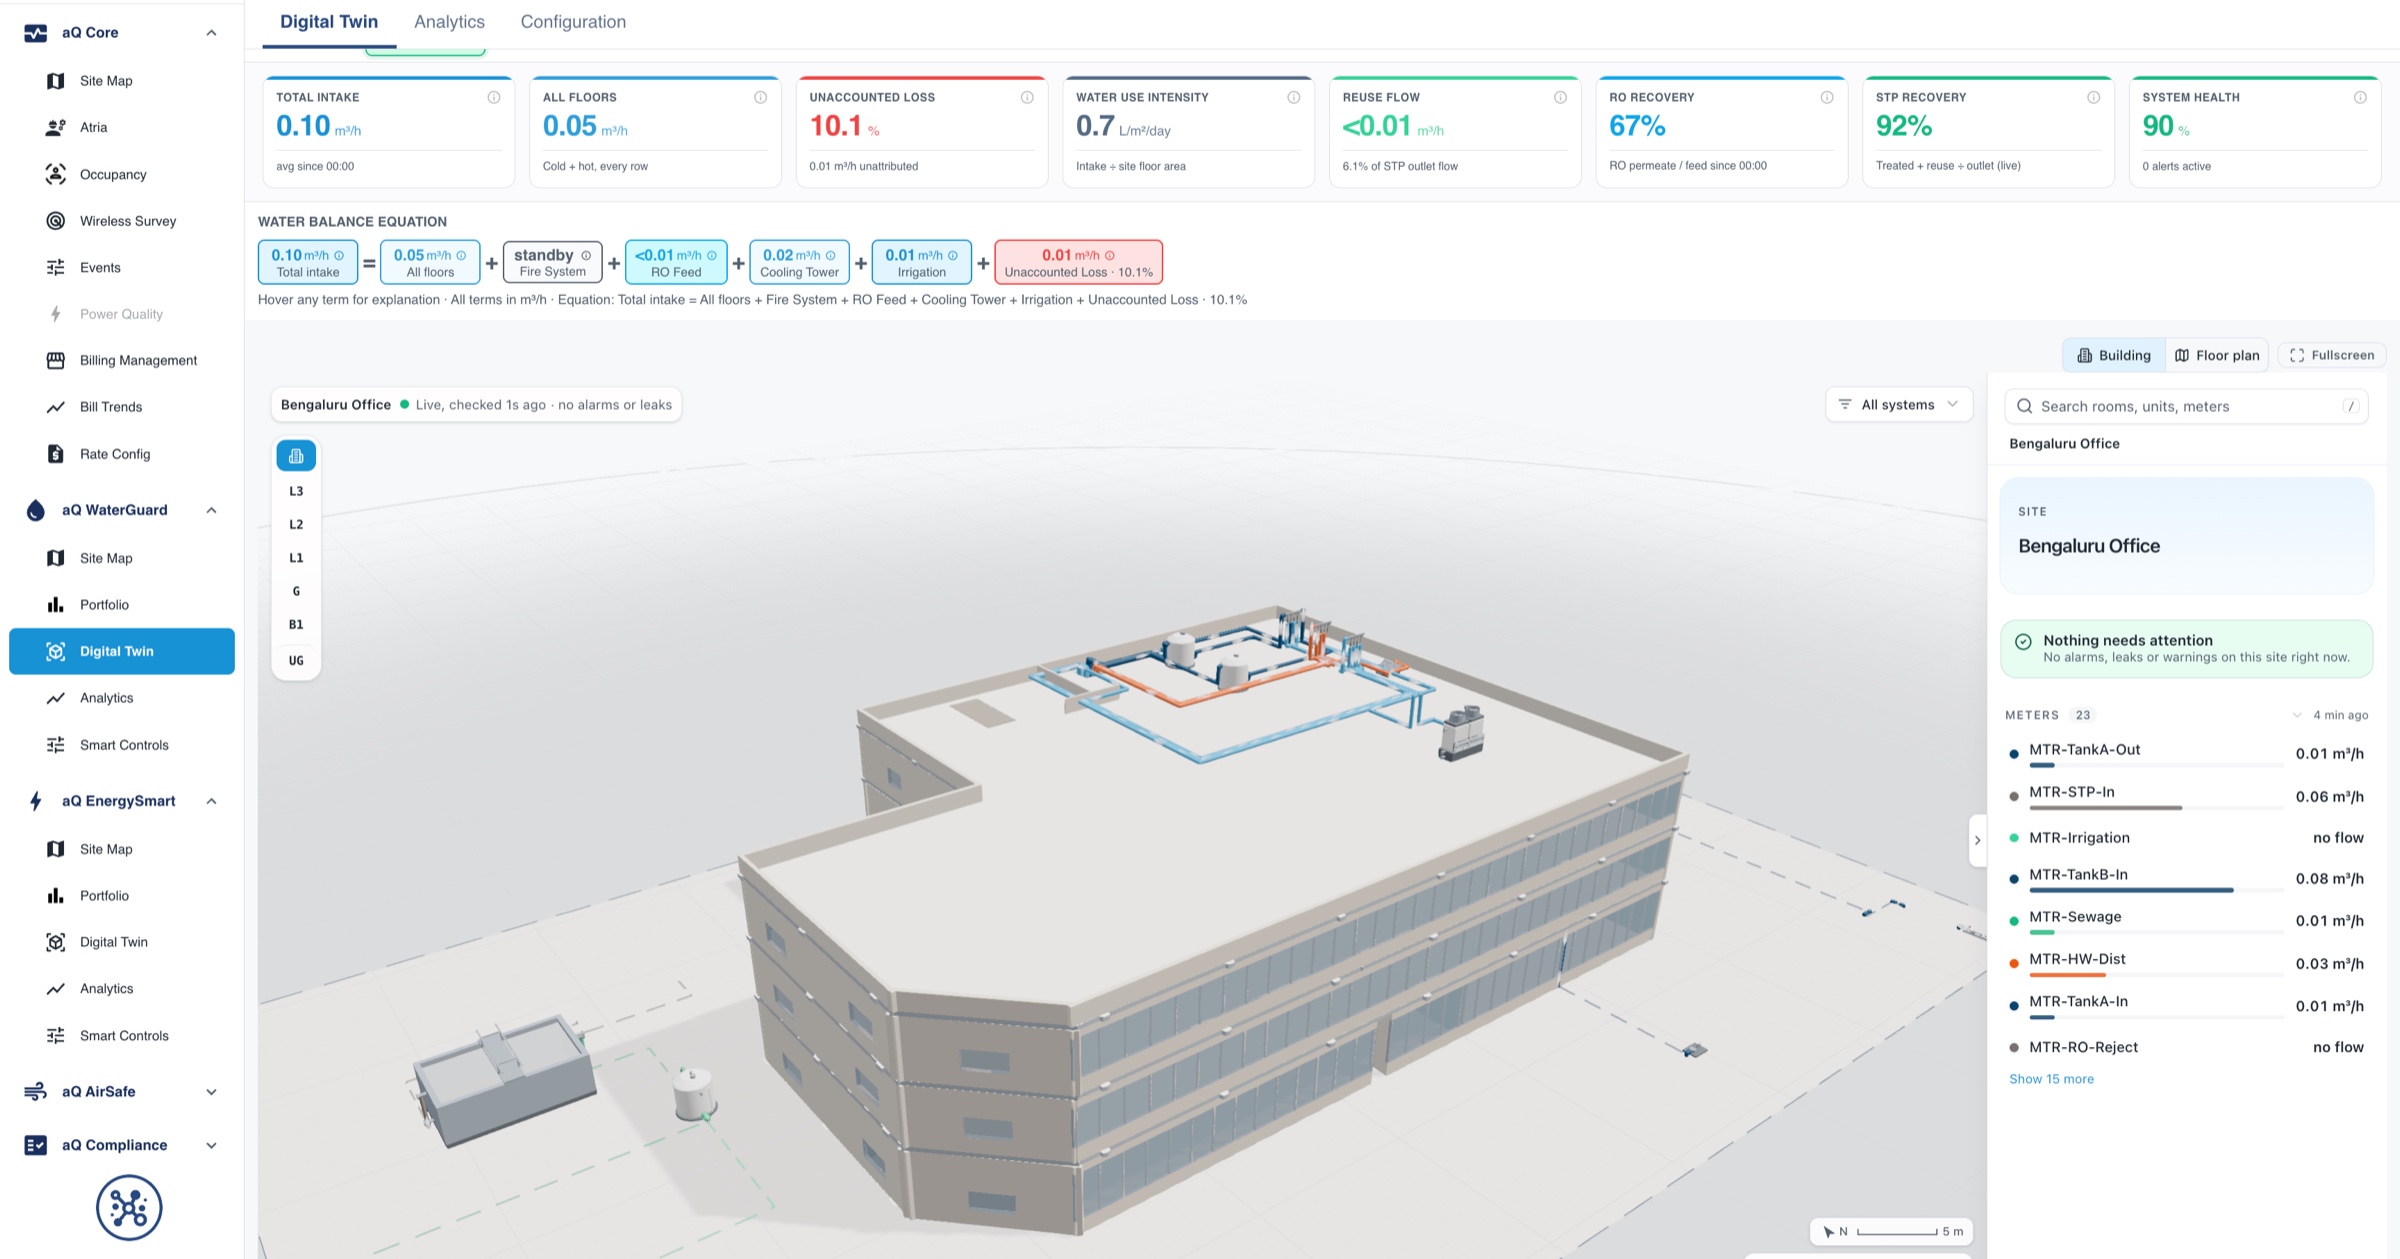
The metrics every report needs
Verified water, energy and air metrics exported monthly for benchmarking and certifications, with your team keeping control of the filing.
Learn moreSeven systems where the BMS reports state and the asset loses value.
A BMS keeps a building at setpoint. It was never built to say what each floor, tenant or system cost, or where water went. Click a system to see where loss hides and what Aqueduct adds above the controls you already run.
Chiller plant
Sequencing and setpoint creep raise kW per ton while the BMS still shows the plant as running normally.
Chiller and pump power, supply and return temperatures, flow, ambient conditions.
Plant efficiency trended against load and weather, with sequencing changes proposed and verified at the meter.
Air handling units
Schedules set at commissioning still condition floors for occupancy that no longer arrives on Mondays and Fridays.
AHU fan power, run hours, damper and valve positions, zone CO2 as a proxy for occupancy.
Run hours matched to measured occupancy. Where control is enabled, with owner approval, schedules follow the building's real week.
Electrical distribution
Consumption is known at the main incomer, so recharge is apportioned by area and peaks are seen only on the invoice.
Feeder and tenancy level kWh, demand profile, power factor.
Measured tenant consumption, peak events traced to the loads that set them, and power factor exposure flagged before billing.
Water
One boundary meter. A failed flush valve or a tower running to drain looks like normal use on a monthly bill.
Intake, cooling tower make-up and blowdown, washroom and irrigation zones, night flow.
aQ WaterGuard balance with unaccounted loss as its own term, and a night flow baseline per zone.
Indoor air
Fresh air runs to a fixed schedule, so floors are over-ventilated when empty and stuffy when full.
CO2, PM2.5, VOC, temperature and humidity per zone.
Zone records tenants and certifiers can see, with ventilation energy tracked against the air quality it buys.
Lifts, lighting and small power
Often unmetered, yet a large share of base building load that ends up guessed in the base building and tenancy split.
Circuit level power on lift, lighting and landlord small power boards.
A base building split built from measurement, not assumption, for ratings and service charge budgets.
On-site generation
Inverter output is known, but self-use, export and avoided cost are not valued against the tariff.
Generation, self-consumption, export, grid import.
Solar valued in money and carbon, and booked against the building's targets.
Six markets, one direction: from design compliance to measured performance.
Every regime below is moving from what a building was designed to do toward what it actually used. That makes metering the first compliance task. Summarized for orientation, not legal advice; confirm the requirement that applies to each asset.
Benchmarking that is turning into performance standards
ENERGY STAR Portfolio Manager is the common benchmarking tool, and a growing number of cities require annual disclosure. Several now go further, with building performance standards that set falling targets and penalties.
- Annual benchmarking from complete, attributable meter data
- Weather-normalized energy use per building, tracked all year
- Evidence of the measures taken, not only the final number
- Measured
- whole building and sub-metered energy and water
- Target
- per your city's ordinance
- Aqueduct
- Portfolio Manager exports and in-year tracking against the target
A national code and a national benchmarking initiative
The National Energy Code of Canada for Buildings governs design, adopted province by province. Natural Resources Canada runs national benchmarking on actual building data, which only works if each site's meter data is complete.
- Per site reporting, because codes vary by province and city
- Complete meter coverage before benchmarking
- Comparable intensity across a national estate
- Measured
- energy and water by site and system
- Target
- per your province and municipality
- Aqueduct
- one measurement definition across every province
MEES, ESOS and SECR pulling the same way
MEES ties lettability to the EPC rating. ESOS requires large organizations to assess energy use and, in its current phase, plan actions and report progress. SECR puts energy, emissions and actions in the annual report.
- An action plan backed by measured consumption
- Actions disclosed with their effect
- Asset-level evidence that the building improved
- Measured
- energy by asset, system and tenancy
- Target
- per the current regulations
- Aqueduct
- verified savings per measure, ready for ESOS and SECR narratives
Green building codes at permit, questioned in operation
Dubai's Al Sa'fat and Abu Dhabi's Estidama Pearl are written at design stage. Dubai's Demand Side Management strategy sets targets for electricity and water demand. Cooling dominates the bill, so efficiency and cost sit on the same lever.
- Cooling allocated by zone and tenant
- District cooling consumption tracked as a purchased utility
- Water metered by end use, because it is desalinated and costly
- Measured
- chilled water energy, kWh, water by end use
- Target
- per the authority's framework
- Aqueduct
- operational evidence against design-stage commitments
An energy code, assured ESG disclosure and a carbon market
ECBC sets minimum standards for larger commercial buildings. For listed entities, BRSR Core energy and water intensity figures carry independent reasonable assurance, so each number has to trace back to a source.
- Energy and water intensity traceable to the meter
- Same definitions across owned and managed assets
- Records an assurance provider can sample
- Measured
- energy and water by building and tenancy
- Target
- per ECBC and your disclosure scope
- Aqueduct
- audit-ready exports with the series behind each figure
A public rating built from your meter data
NABERS rates measured operational performance for the base building, the tenancy or the whole building, and large offices must disclose it. A design certificate does not help; the rating is arithmetic on actual consumption.
- Base building and tenancy separated by measurement
- Complete data over the full rating period
- Visibility of what is holding the rating down
- Measured
- base building and tenancy energy and water
- Target
- your target star rating
- Aqueduct
- rating-period data with the drivers ranked
How a tenant recharge figure is built from measurement.
Map the boards to the lease
Each distribution board, feeder and sub-meter is tied to a tenancy, a landlord service or a common area in aQ Core's site model, floor by floor.
Fill the gaps with clamp-on metering
Split-core current transformers and clamp-on flow meters go in during occupied hours where no meter exists. Nothing is shut down.
Reconcile to the main
Sub-meters must add up to the incomer. Any gap appears as an unattributed term, so a missing circuit is found before a bill is issued.
Split shared plant fairly
Chilled water and air from shared plant are allocated by measured delivery where it is metered, and by an agreed rule where it is not. The method is recorded with the figure.
Issue and defend
Each tenant's consumption is exported with its series. Whether and how it is recharged is a matter for the lease and local rules; Aqueduct supplies the measurement underneath.
Five leaks a monthly bill will never show you.
Each one has a clear signature once the building is measured at the right resolution.
| What is happening | The signature in the data | What happens next |
|---|---|---|
| Floors conditioned for people who are not there | AHU run hours flat while zone CO2 shows partial occupancy | Schedules aligned to measured occupancy, where control is enabled, with owner approval |
| Chiller plant drifting from its best sequence | kW per ton rising at the same load and weather | Sequencing change proposed, then verified against baseline |
| Failed flush valve or stuck fill valve | Night flow in one zone above its baseline | Ticket to the CMMS naming the zone and the hours lost |
| Cooling tower running to drain | Make-up rising without matching cooling load | Blowdown and float valve checked, with the cost of each day shown |
| A peak set by one uncoordinated start | A demand spike traced to a set of feeders at one time | Start-up sequence staggered so the peak is not repeated |
One building first, then the portfolio.
A commercial real estate developer with 20M+ sq ft runs its portfolio on Aqueduct. The pattern is the same at any scale: prove one asset, then apply the same definitions everywhere.
Survey and baseline
BMS points, meters, plant and water intakes mapped. Twelve months of bills loaded, so a weather-normalized baseline exists from the start.
Integration and metering
Gateway placed, BMS read over BACnet or Modbus, clamp-on meters added floor by floor during occupied hours.
First findings
Tenant consumption attributable, water balance closed, first HVAC and water losses named against the baseline and valued in money.
Portfolio ranking
Each building added on the same definitions, then ranked by normalized intensity and cost, so capital goes to the worst performer rather than the loudest.
The same data, answered for each owner of the asset.
Asset manager
Buildings ranked by normalized intensity and cost, with the value of fixing each one.
Head of engineering
Plant efficiency and faults across every building, whatever BMS each one has, with tickets confirmed closed.
Learn moreProperty manager
Measured tenant consumption and a service charge budget built from metered base building load.
ESG lead
Benchmarking and disclosure numbers that trace back to meters, ready for assurance.
Learn moreLeasing team
Measured air quality and energy performance to answer occupier questions with records.
Proven in live sites.
Anonymized results, verified at the meter.
portfolio of a commercial real estate client, on one platform
Features that matter here
Common questions
It supplies the measured, weather-normalized energy numbers per building that those standards are judged on, and tracks them through the year. You file.
No. Aqueduct is system-agnostic. Keep, replace or build in.
Against a baseline modeled before the claim, confirmed at the meter.
Yes. Lift, lighting, landlord small power and shared plant are metered at circuit or feeder level, so the split is measured rather than assumed. That split feeds ratings, service charges and recharge.
Zone CO2 and other occupancy signals show when floors are actually used. Plant schedules can then follow the real week, where control is enabled, with owner approval.
Aqueduct can read meters directly over LoRaWAN, Modbus or cellular, and Smart Controls can be added for the loads that matter. The building then appears in the portfolio on the same definitions as the rest.
Where chilled water delivery is metered per tenancy, by measurement. Where it is not, by an agreed rule that is recorded with every figure, so the method can be explained and audited.
It supplies the complete, attributable consumption data both depend on and exports it in the form those tools need. You submit and the rating body rates; Aqueduct supplies the measured evidence.
See Aqueduct on your own facility.
Bring a site, a utility bill or a question. We will show you where the loss is.