Facility intelligence solutions for your role, your industry and your problem
Facility intelligence solutions are the ways one platform maps to your work. Aqueduct connects meters, sensors and building systems, finds water, energy and air losses, routes fixes into your CMMS, acts where control is enabled with owner approval, and verifies every result at the meter. Browse it by persona, by industry or by use case.

One platform, three ways in: your seat, your industry, your problem.
Every seat sees the same verified numbers, framed for its job
- Facilities and engineering
Live digital twins, fault logs and tickets with evidence, so the team fixes the right thing first.
- Finance and real estate
Bill validation, weather-normalized baselines and cost per site, so budgets rest on metered data.
- Leadership and IT
Portfolio outcomes for the board, and security, integrations and deployment options for the IT review.
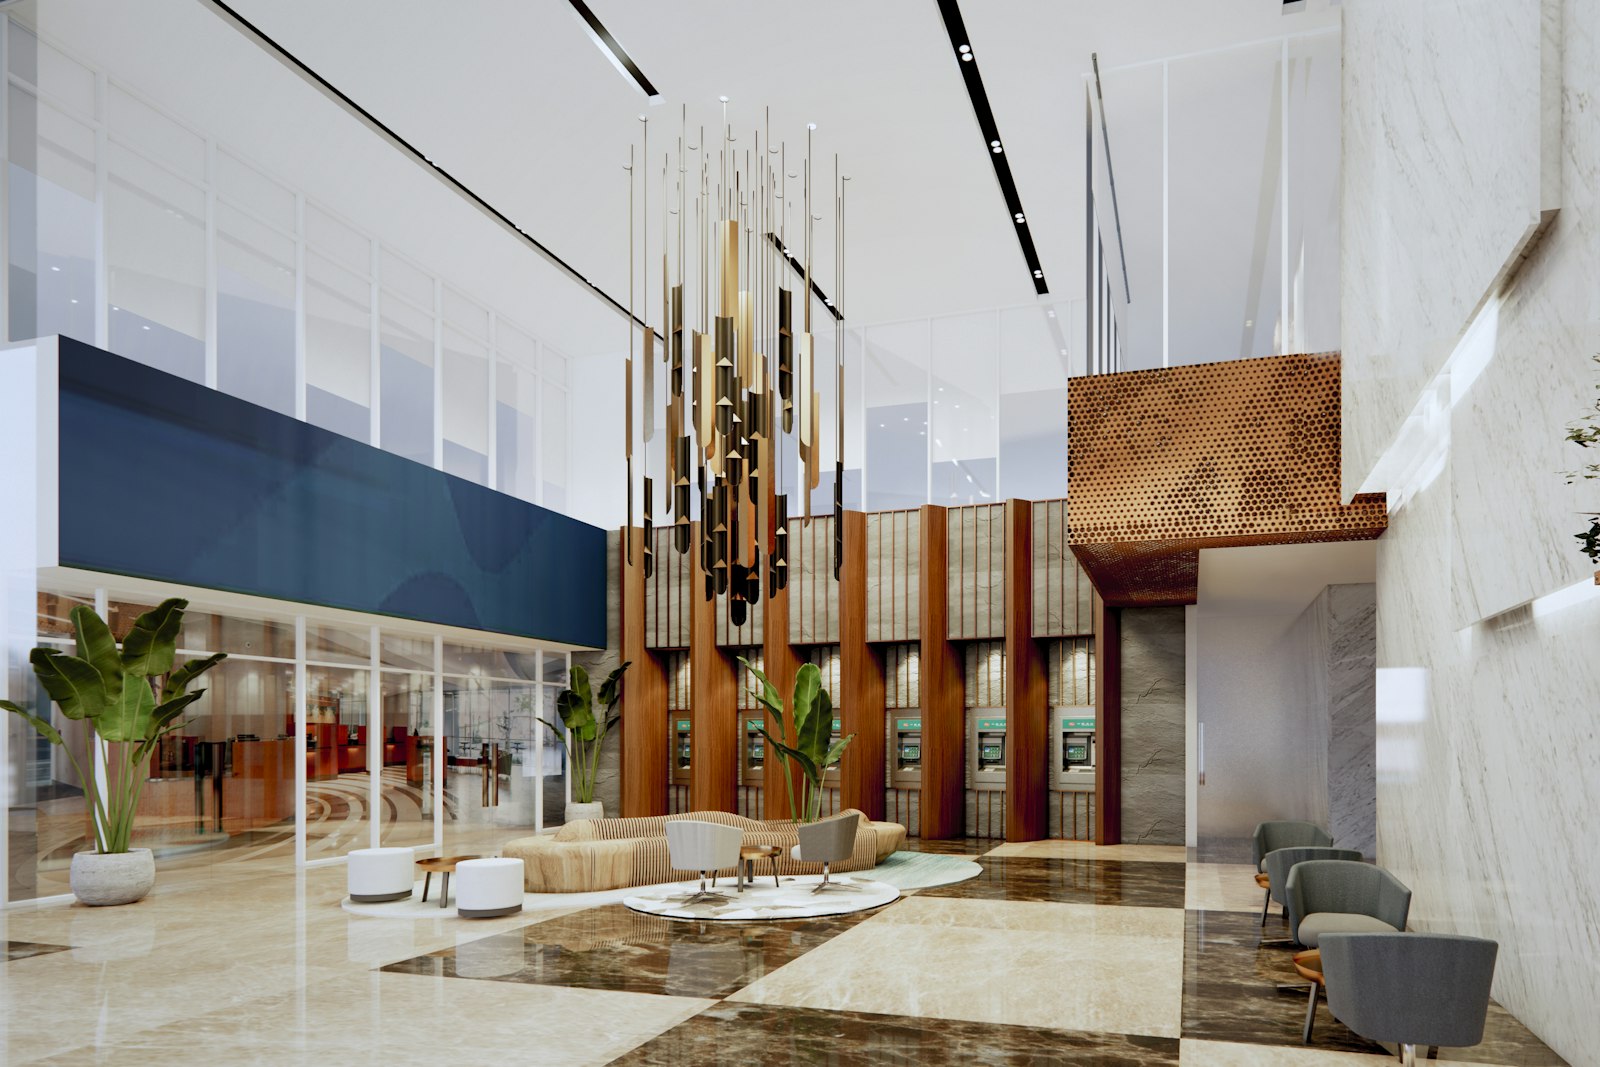
Built for the buildings and networks you actually run
- Hospitals and campuses
Water balance, air health and equipment uptime across wards, labs and plant rooms on one data layer.
- Airports, venues and offices
High-occupancy sites where water, energy and air move with crowds, flights and event schedules.
- Plants, dairy and data centers
Process water, power quality and cooling load measured at the line and the feeder, not the bill.

Start from the problem and see what it takes to fix
- Problem first
Each use case opens with the pain in plain language, then the steps Aqueduct runs to resolve it.
- What it needs on site
Meters, sensors and controllers listed plainly, connected from existing devices or installed through partners.
- Proof at the meter
Every use case ends in Verify, where the meter confirms the fix worked and sets the new baseline.

Facility software, before and after Aqueduct
- One tool per resource, one login per vendor, no shared numbers.
- Each team argues from its own spreadsheet and its own meter.
- Alerts arrive, but nobody owns the fix or confirms it.
- Savings are estimated in a proposal and never measured.
- Old buildings and new builds run on different stacks.
 The Aqueduct way
- Water, energy and air on one data layer, aQ Core.
- Every seat reads the same metered numbers, framed for its job.
- Fixes route into your CMMS with evidence, then the meter confirms.
- Savings are measured against a weather-normalized baseline.
- Keep your BMS, replace it, or build Aqueduct in at design.
Three ways to find your solution
Every path leads to the same platform and the same verified data. Pick the one that matches how you think about the problem.
By persona
Start from your seat. See the problems you own, what Aqueduct gives you and the questions your role asks.
Learn moreBy industry
Start from your sector. Hospitals, airports, real estate, dairy, data centers, campuses, cities and utilities.
Learn moreBy use case
Start from the problem. Each use case shows the steps, what it needs on site and how the result is verified.
Learn moreSeats that run the buildings
The people who keep water flowing, air healthy and equipment running.
Facilities managers and directors
Leaks, faults and complaints found, routed to your CMMS and confirmed closed at the meter.
Learn moreBuilding, MEP and controls engineers
Live digital twins of water, electrical and HVAC systems, with the points and protocols behind them.
Learn moreOperations leaders and COOs
Uptime, response and verified fixes across sites, without replacing the CMMS your teams run.
Learn moreSustainability and ESG leads
Metered water, energy, carbon and air data, weather-normalized, ready for the reports your team files.
Learn moreSeats that fund, own and govern them
The people who sign off budgets, own the assets and approve the platform.
CFOs and finance teams
Utility spend, bill validation, budgets and savings verified at the meter, not estimated.
Learn moreHeads of real estate and portfolio leaders
Every building ranked on normalized intensity and performance against baseline, across the portfolio.
Learn moreCTOs, CIOs, IT and data teams
Security, integrations, cloud or on-prem deployment and the certifications your review asks for.
Learn moreCEOs and executive leadership
Portfolio outcomes in water, energy and air, measured at the meter and stated in money.
Learn more
Every seat in the building should be reading the same verified number.
Talk to our teamUse cases that find and stop loss
Water, energy and controls problems that cost money every hour they run.
Reduce water loss
Close a live water balance, find unaccounted flow, locate it to the line and confirm the fix at the meter.
Learn moreWater reuse, STP and RO
Track treatment plant efficiency, RO recovery and reuse flow so recycled water is measured, not assumed.
Learn moreRestroom monitoring
Odor, sound levels, occupancy and water use combined to flag running toilets and cleaning needs, without recording audio.
Learn moreHVAC energy optimization
Baseline HVAC against weather, find the waste, adjust where control is enabled and verify the saving.
Learn moreOccupancy-based HVAC control
Run equipment to real occupancy from sensors or schedules, with every command logged and audited.
Learn morePeak demand and tariffs
See peak kW as it builds, sequence loads to stay under your demand band and track power factor.
Learn moreUse cases that protect people, assets and the numbers
Air, uptime, billing and reporting problems where proof matters as much as the fix.
Indoor air quality compliance
CO2, PM2.5, VOC and exposure in zone-hours, with the measured evidence your standards ask for.
Learn moreEquipment uptime
Faults diagnosed and routed to your CMMS, early signs of failure caught and device health tracked.
Learn moreUtility bill validation
Compare what the utility billed with what your meters measured, and split usage changes from rate changes.
Learn moreTenant submetering and billing
Tenants, meters per tenant and anomalies per tenant, with bills generated from metered data.
Learn moreESG and sustainability reporting
Metered water, energy, carbon and air data for the reports and certifications your team files.
Learn morePortfolio benchmarking
Rank sites on normalized intensity and performance against baseline, then act on the outliers first.
Learn moreWhere teams put it to work
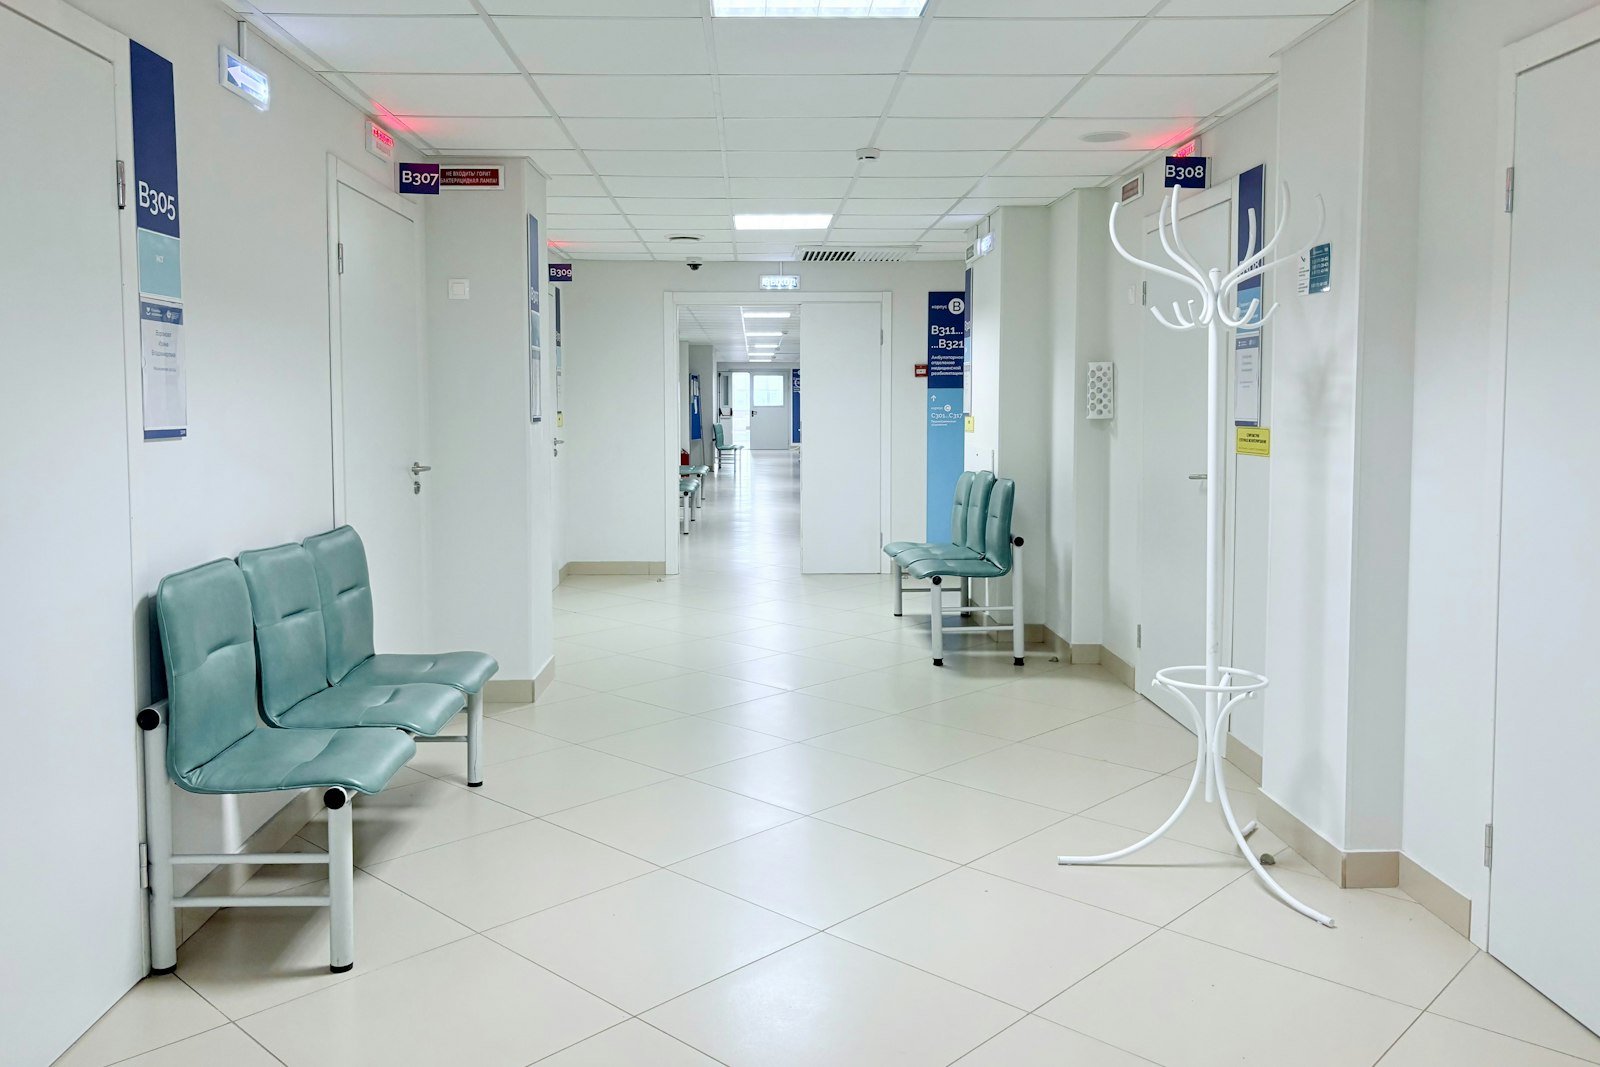
Wards, labs and plant rooms on one platform
A hospital chain with 22 hospitals and 9 clinics is a client. Water, energy and air are measured across its sites so every team acts on the same data.
Learn more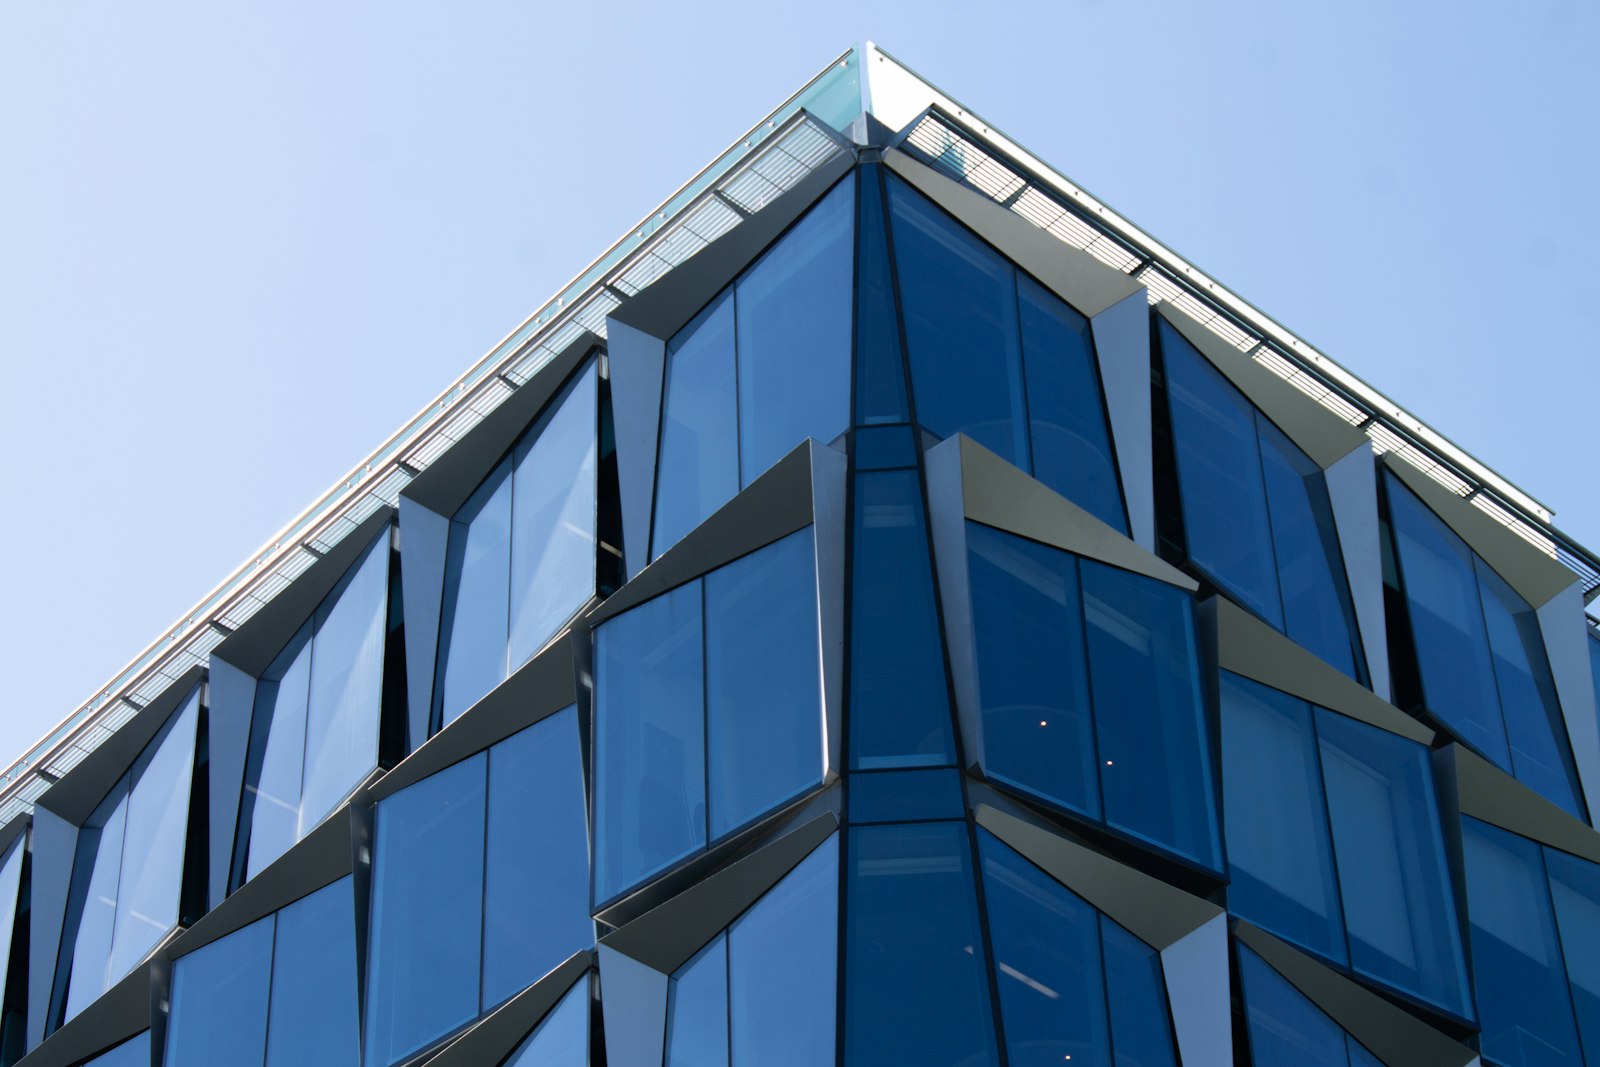
A 20M+ sq ft portfolio, read site by site
A commercial real estate client with a 20M+ sq ft portfolio uses Aqueduct to compare buildings on normalized intensity and act on the outliers first.
Learn more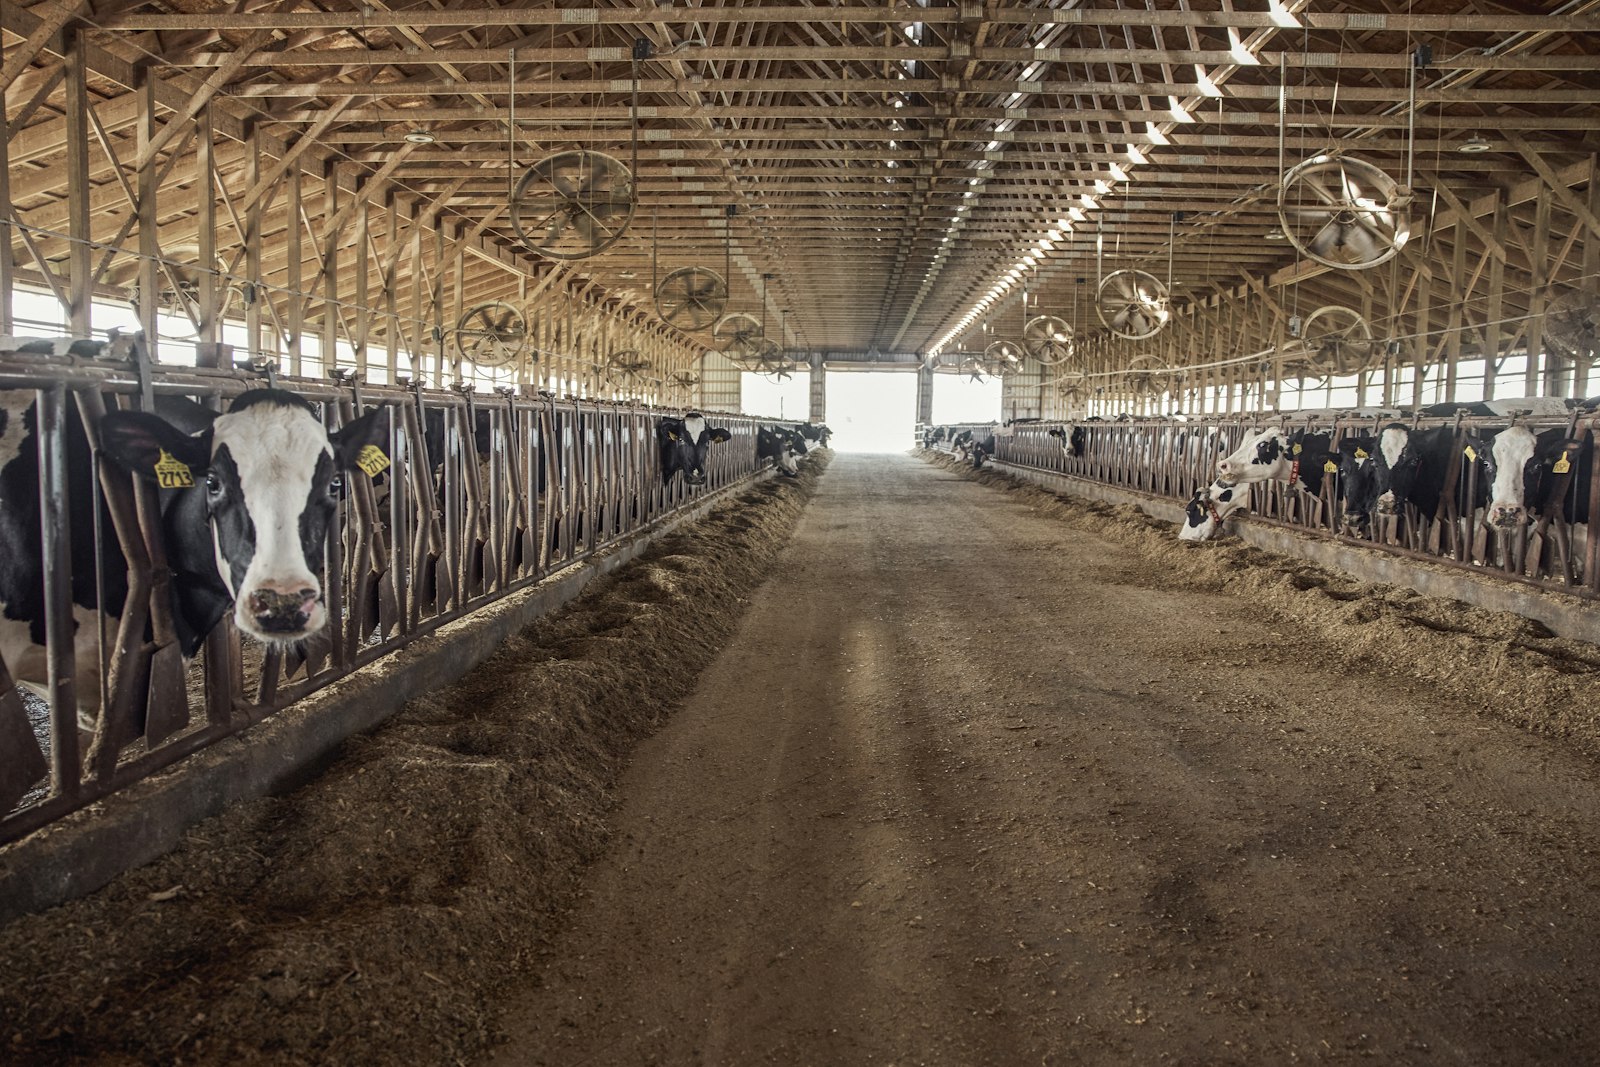
Process water and power seen at the line
Major dairy operations run on Aqueduct, metering process water, refrigeration and power so loss shows up at the line instead of on the monthly bill.
Learn moresites in 21 countries run on Aqueduct.
and 9 clinics in one of India’s top hospital chains.
US airport running water intelligence on Aqueduct.
of commercial real estate under Aqueduct.
FMCG manufacturing campus.
operations run on Aqueduct.


Related
Common questions
A facility intelligence platform connects the meters, sensors and building systems on a site, turns their data into findings and acts on them. Aqueduct, from Milvian AI, does this for water, energy and air on one data layer, routes fixes into your CMMS and verifies every result at the meter.
Start from the view that matches how you think: your role on the persona pages, your sector on the industry pages, or a specific problem on the use case pages. All three lead to the same Aqueduct platform and the same verified data, framed differently.
It can. Aqueduct can replace a BMS, BAS or EMS, work across the systems you keep, or be built into a new building at design stage. Many portfolios mix approaches building by building.
No. Aqueduct integrates with your CMMS. It routes tickets with the location, the evidence and a recommended fix into the system your team already uses, then confirms at the meter that the fix worked.
Savings are verified at the meter against a weather-normalized baseline, so each result is measured rather than estimated. Aqueduct is deployed in 275+ sites across 21 countries. Results depend on each site's starting point and on what the team acts on.
Not necessarily. Aqueduct is device agnostic and connects anything that emits telemetry, including existing meters and BMS points over LoRaWAN, Modbus, BACnet, MQTT, M-Bus or pulse outputs. Where more devices are needed, installation runs through partners.
Yes. Aqueduct runs in the AWS cloud or on-premises, including on-prem AI on NVIDIA infrastructure. Milvian AI is an NVIDIA Inception member and an AWS Advanced Tier Partner.
See Aqueduct on your own facility.
Bring a site, a utility bill or a question. We will show you where the loss is.