ESG data for building sustainability reporting, measured at the meter
ESG data for building sustainability reporting is the measured water, energy, carbon and air information that reports depend on. Aqueduct collects it from meters and sensors, normalizes it for weather, verifies savings at the meter and exports monthly metrics. Your team or consultant prepares and files the report; Aqueduct supplies the evidence behind every number.
The verified numbers behind every sustainability report your team files.
Water, energy, carbon and air from the meter
- Every 60 seconds
Meters and sensors report continuously, so reporting periods close on time without chasing utility invoices.
- Carbon from consumption
Electricity converts to carbon with the grid factor, shown with its source and year.
- Coverage shown
Device health and connectivity show where data is complete and where it needs a note.
Progress separated from weather and size
- Degree-day baselines
Regression on cooling and heating degree days separates weather effects from the real change your team made.
- Normalized intensity
Per square foot and per visitor figures make sites of different sizes and uses comparable.
- Day-one start
Uploading 6 to 12 months of bills gives a baseline straight away.
Verified savings and monthly exports for your reporting team
- Verified at the meter
Savings are confirmed at the meter after each fix, never taken from a proposal or projection.
- Monthly export
Verified metrics by site and period are exported monthly, ready for the reporting workbook or consultant.
- You file
Your team or consultant prepares, files and certifies the report, and Aqueduct supplies the measured evidence behind it.

ESG data, before and after Aqueduct
- Figures are keyed in from invoices after the period.
- Each site reports in its own way.
- A mild year is mistaken for progress.
- Savings come from proposals, not from meters.
- Data gaps are hidden in totals.
 The Aqueduct way
- Figures come from meters, continuously, by site.
- Every site reports on one consistent basis.
- Degree-day baselines separate weather from action.
- Savings are verified at the meter.
- Coverage is visible and gaps are noted.
Why reporting data is weak
Sustainability reports are often built from invoices, estimates and late spreadsheets.
Invoice data, months late
Energy and water figures are keyed in from bills after the period closes, with gaps and estimates.
Inconsistent across sites
Each site reports in different units, periods and levels of completeness.
Weather distorts progress
A mild year looks like improvement and a hot one like failure, regardless of action taken.
Savings without evidence
Reported savings come from project proposals rather than measurement.
How Aqueduct supplies reporting data
One reporting period, from meter to export.
Main meters, sub-meters and air sensors report into aQ Core every 60 seconds, with device health showing coverage.
Water, energy and gas are totaled by site and period, and baselines are weather-normalized with cooling and heating degree days.
Sites above baseline are flagged, and data gaps are marked so they can be noted rather than hidden.
Findings go to the teams that fix them, so the next period's numbers improve as well as get reported.
Savings are verified at the meter and monthly metrics are exported for your team or consultant to file.
What it needs on site
Existing meters connect if they emit telemetry. New devices are installed through partners.
| Device | What it measures or does | Why it matters |
|---|---|---|
| Main utility meters | Electricity, water, gas | Site totals for each reporting period |
| Sub-meters | Consumption by building, floor or process | Explains where change came from |
| Grid carbon factor | kg CO2 per kWh, with source and year | Converts electricity to carbon |
| IAQ sensors (optional) | CO2, PM2.5, VOC by zone | Evidence for healthy building commitments |
| Utility bills, 6 to 12 months | Historical use and rates | Baseline and the reporting starting point |

Frameworks the data can feed
Aqueduct supplies measured data. Your team or consultant reports, files and certifies against each framework.
Who cares about this
The seats that ask for this first.
Where teams put it to work
Portfolio reporting on one basis
A commercial real estate client with a 20M+ sq ft portfolio compares buildings on normalized intensity for consistent reporting.
Learn more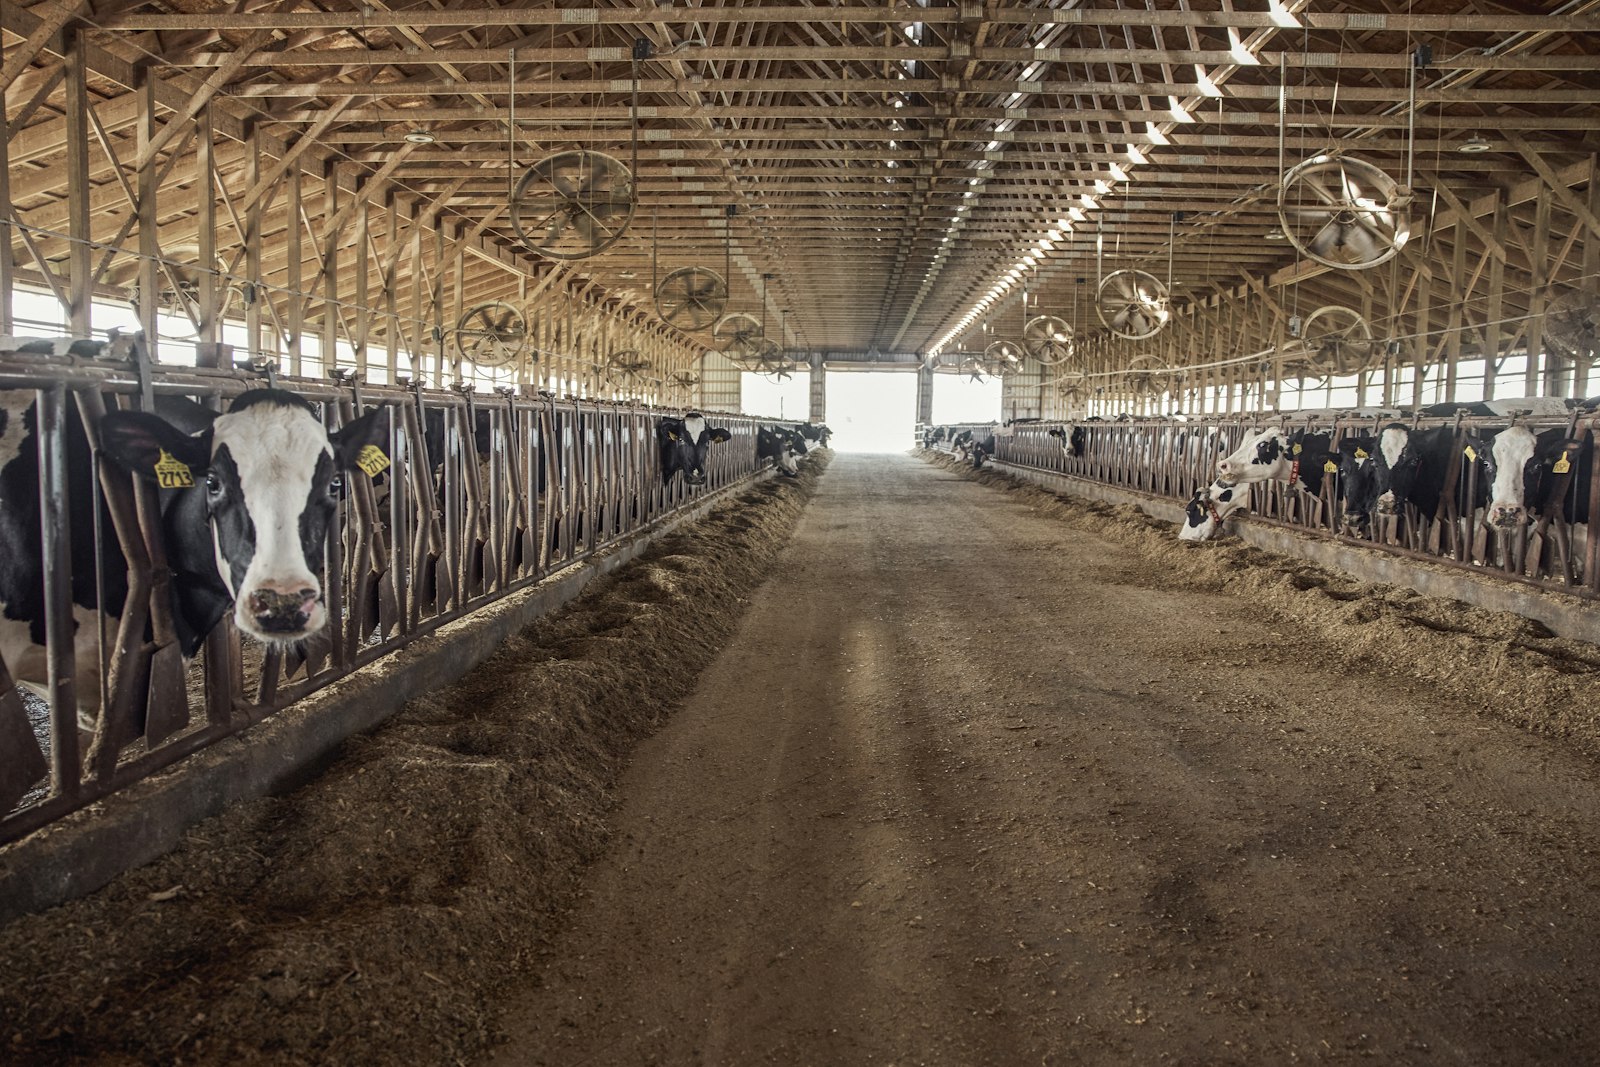
Process water and energy reported
Major dairy operations run on Aqueduct, with process water and energy measured at the line for sustainability reporting.
Learn more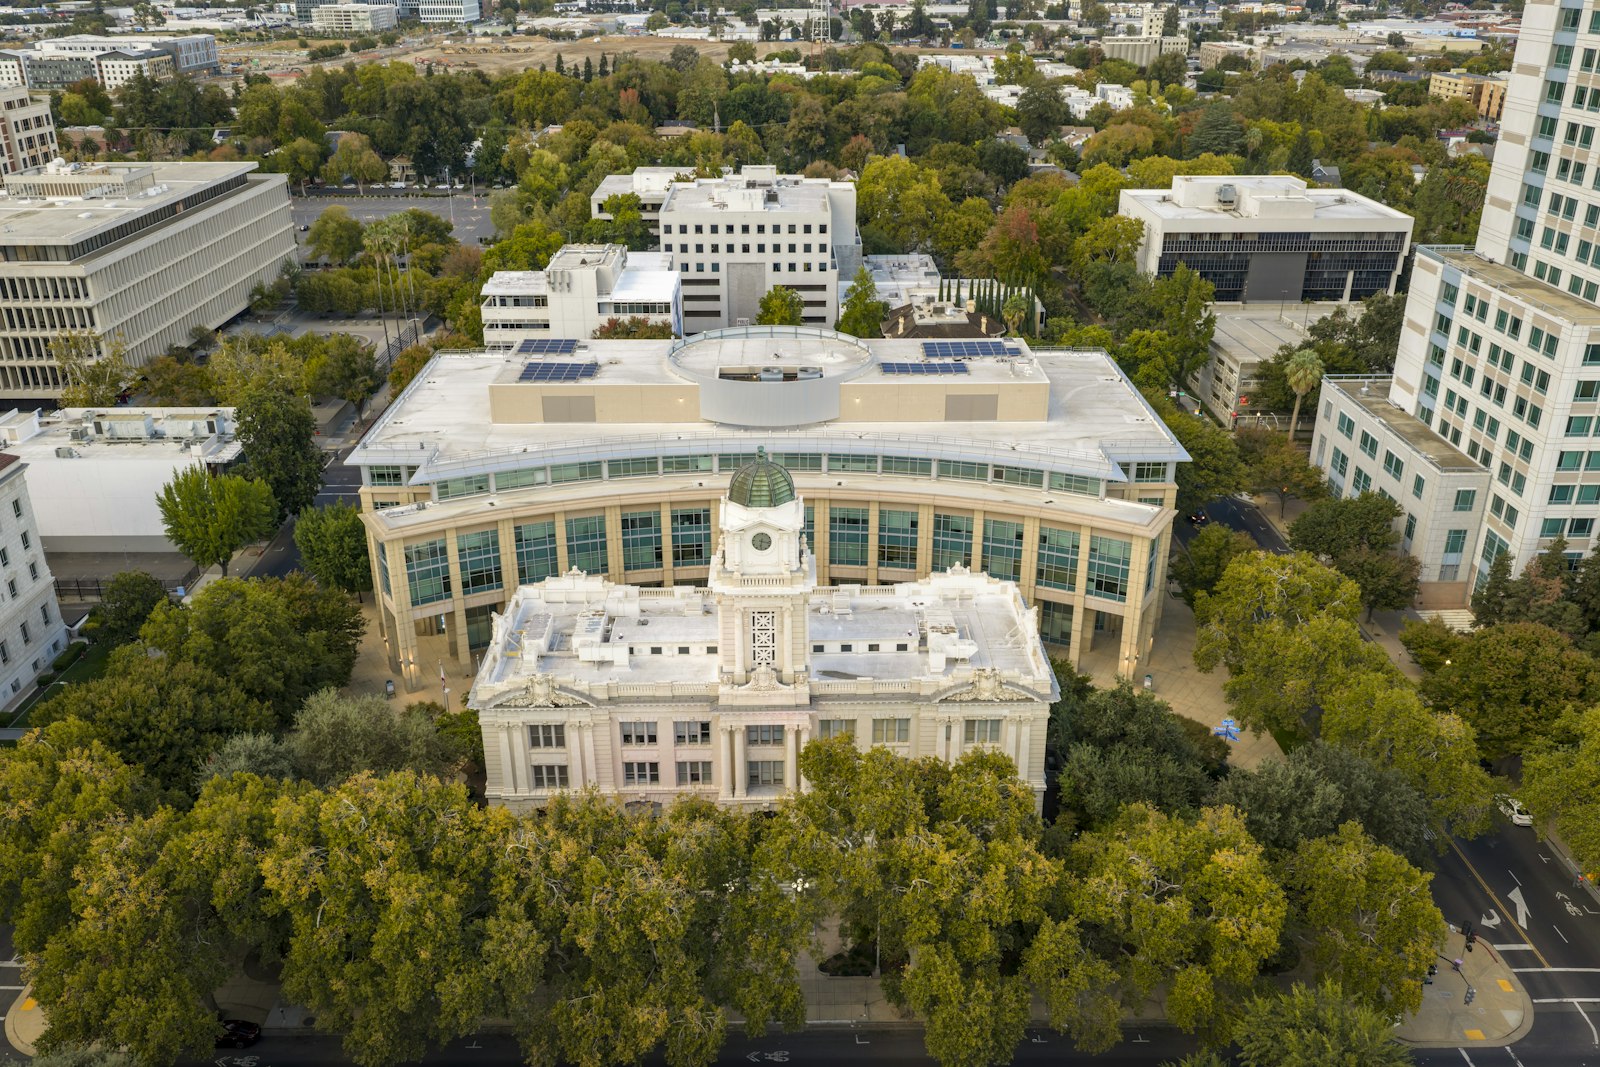
Public commitments with evidence
Public bodies use metered data for benchmarking and climate commitments, with reports prepared and filed by their own teams.
Learn moreDisclosure now expects measured, assured data
top listed Indian companies required to obtain reasonable assurance on BRSR Core from FY 2023 to 24, on a glide path to 1,000 by FY 2026 to 27
Source: SEBI circular on BRSR Core, assurance and value chain disclosures, 12 July 2023the year mandatory NABERS energy disclosure began for large office buildings in Australia
Source: NABERS: supporting industry through the Commercial Building Disclosure expansionDubai's target cut in electricity and water demand by 2030, against business as usual
Source: MEED: Dubai updates energy savings targetSeven places a sustainability number goes wrong
Most weak figures are not wrong on purpose. They break at a handoff between the meter and the report.
Invoices as source
Figures keyed in from bills months after the period, with estimated reads
Main meters per billing period
Replaces keyed figures with metered totals
Unmetered sites
Small sites estimated from floor area and filled in the same way every year
Bills uploaded for day-one baselines
Marks estimated sites so they are disclosed as estimates
Weather
A mild year reported as progress
Cooling and heating degree days per site
Weather-normalized baselines
Boundaries
Sites added or sold without restating prior years
Site hierarchy in aQ Core
Consistent boundaries period over period
Emission factors
Factors from the wrong year or grid
Grid factor per site with source and year
Shows the factor next to the number
Water reuse
Recycled water reported from plant design capacity
Reuse line meters, RO and STP flows
Reuse from measured flow only
Savings claims
Project savings copied from proposals
Use after the fix against baseline
Verified at the meter
A reporting pack built from the meter
What Aqueduct exports each month, and how a reporting team or assurance provider uses it.
| Export | Contents | Used for |
|---|---|---|
| Consumption by site and period | Electricity, water and gas totals | Energy and water footprint disclosures |
| Coverage and gaps | Meter coverage and missing days per site | Disclosing estimates openly |
| Baseline method | Regression inputs and degree-day source | Explaining normalized trends |
| Emission factors | Grid factor per site with source and year | Scope 2 calculation review |
| Water balance | Supply by source, reuse, unaccounted loss | Water stewardship reporting |
| Verified savings | Per project, units and money | Progress narrative and targets |
| Air quality summary | CO2, PM2.5, VOC and zone-hours by site | Healthy building commitments |
Ready for the next reporting cycle
An illustrative timeline that starts from the report deadline and works back.
Bills and boundaries
Utility bills for every site upload and the reporting boundary is set in aQ Core, with sites marked metered or estimated.
Meter the material sites
The sites that carry most of the footprint are connected first, so the largest share of each total is measured.
Close and export
Monthly metrics are exported with coverage notes, so the year-end close is a sum, not a scramble.
Hand over the evidence
Your team or consultant prepares the report, and the assurance provider can trace each total back to the series behind it.
sites in 21 countries run on Aqueduct.
and 9 clinics in one of India’s top hospital chains.
US airport running water intelligence on Aqueduct.
of commercial real estate under Aqueduct.
FMCG manufacturing campus.
operations run on Aqueduct.





Related
Common questions
Typically energy use and the resulting carbon emissions, water use, and increasingly indoor air quality and waste. Aqueduct supplies metered energy, water, carbon and air data by site and period for the reports your team files.
No. Aqueduct provides the metrics, verified savings and exports. Your sustainability team or consultant prepares, files and certifies the report.
Metered electricity is multiplied by the grid carbon factor, which Aqueduct shows with its source and year. Your team applies the accounting method your framework requires.
Aqueduct supplies measured energy, water and carbon data that such frameworks ask for. Submission, methodology choices and assurance remain with your team or consultant.
Metered data is available continuously, by site and sub-system, with gaps visible. Aqueduct also uses bills for a day-one baseline, so both sources reconcile.
Yes. Savings are verified at the meter against a weather-normalized baseline.
Continuity, attribution and traceability: a continuous series rather than monthly readings, consumption attributed below site level, and every total decomposable to its raw data with no unrepeatable manual step. Aqueduct supplies that record; the provider forms the opinion.
Yes. Sites without metering can be based on uploaded bills, and each total carries a note on how much was measured and how much was estimated.
It measures energy and water consumption by site and source and keeps the series behind every figure. Your team maps the data to BRSR Core and the assurance provider reviews the derivation.
Because data is held per site in aQ Core, totals can be recalculated for a new boundary. Your reporting team decides how to restate and disclose.
See Aqueduct on your own facility.
Bring a site, a utility bill or a question. We will show you where the loss is.