Facility management software by role, one platform for every seat
Facility management software by role gives each seat the view it needs from the same data. Aqueduct gives facilities teams verified fixes, engineers live digital twins, sustainability leads metered evidence, finance validated bills, IT a secure integration layer and executives portfolio outcomes, all on one data layer and verified at the meter.


Eight seats, one data layer, and every number verified at the meter.
Findings that turn into work orders, then into proof
- Facilities teams
Leaks, faults and complaints arrive located, explained and priced, then route into your CMMS.
- Engineers
Live twins show the water balance, the electrical single line and every RTU component state.
- Operations leaders
Response and closure tracked across sites, with the meter confirming that each fix held.

Numbers that hold up in a budget review or an audit
- Finance teams
Billed versus metered consumption, usage changes split from rate changes, savings in money.
- Sustainability leads
Weather-normalized water, energy and carbon data traceable down to the device that measured it.
- Real estate leaders
Buildings ranked on intensity per square foot and per visitor, so outliers surface first.

A platform IT can approve and leadership can stand behind
- Security posture
ISO/IEC 27001, ISO 9001:2015 and SOC 2 Type 2, with cloud or on-prem deployment options.
- Open protocols
BACnet, Modbus, MQTT, M-Bus, pulse and LoRaWAN, so existing equipment connects without lock-in.
- Executive view
Portfolio outcomes stated as measured results, never as a guarantee or a projection.
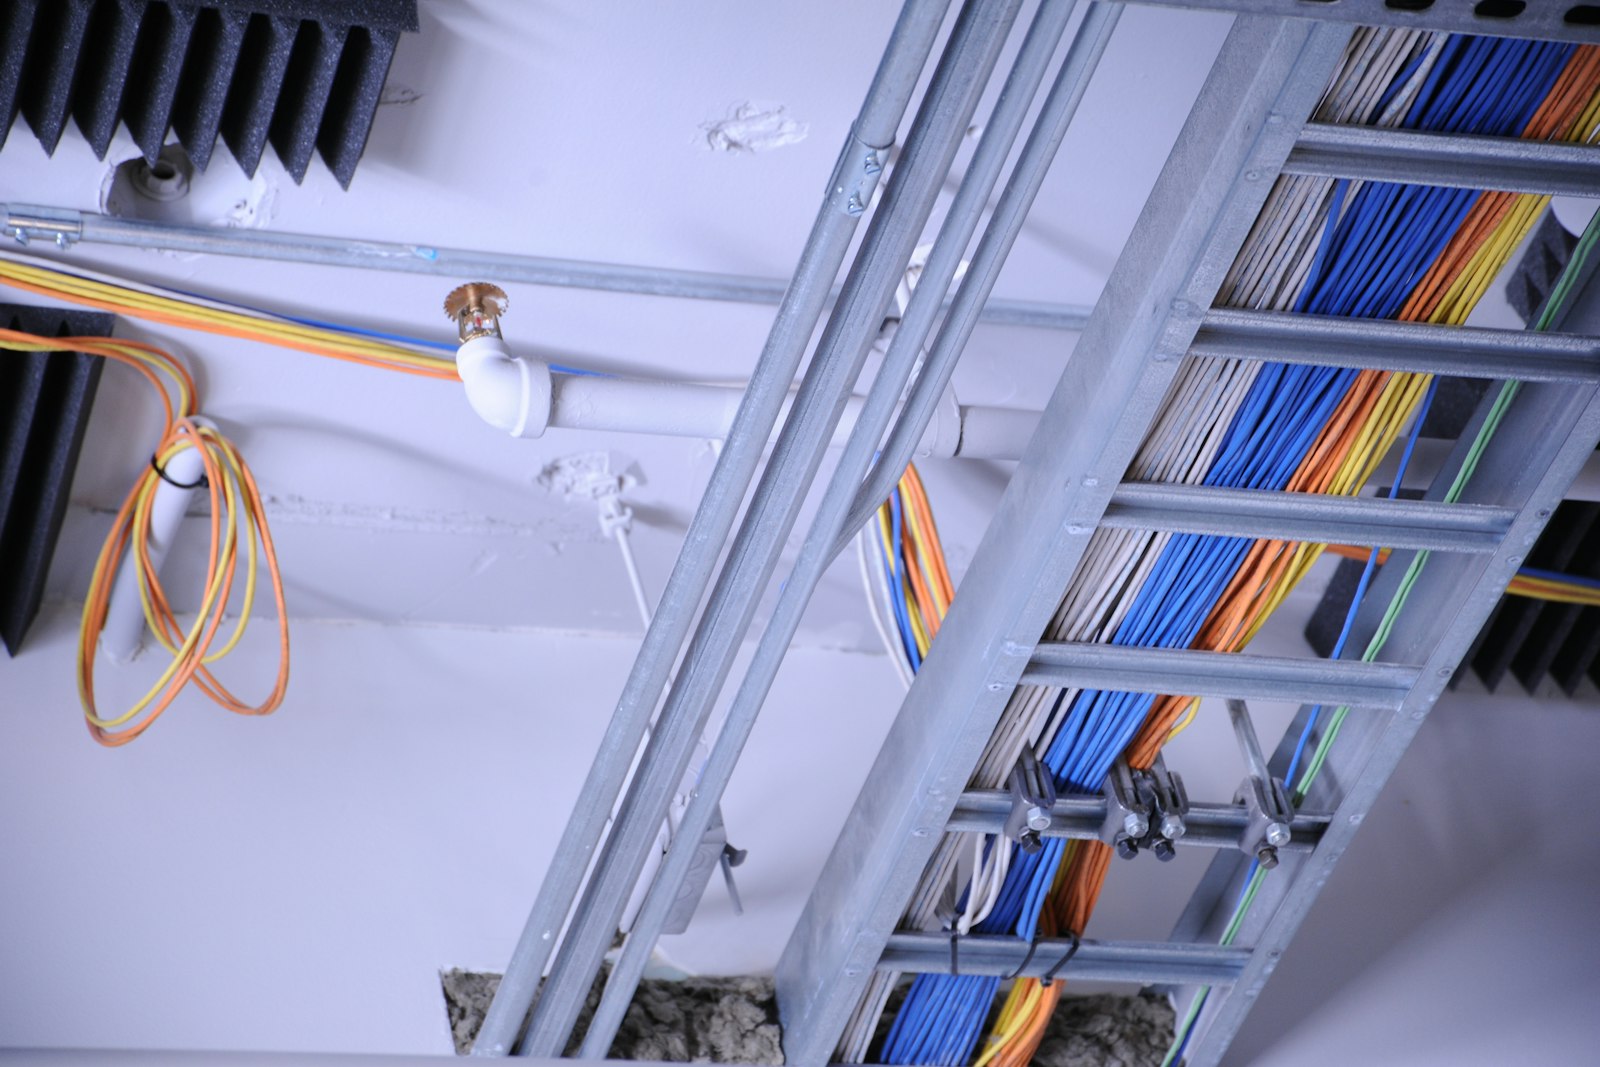
Role-based building data, before and after Aqueduct
- Every department buys its own tool and trusts only its own numbers.
- Finance waits for the bill to learn what happened.
- Engineers export trend logs to answer a manager's question.
- IT discovers building systems only after something breaks.
- Leadership hears savings claims nobody can reconcile.
 The Aqueduct way
- One metered data layer, a view for every seat.
- Finance sees billed against metered consumption every cycle.
- Anyone asks aQ Assistant and gets an answer with data quality noted.
- IT approves one governed platform across every building system.
- Savings reconcile to the baseline, the meter and the bill.
Energy management software for facility managers that finds the fix and proves it
Energy management software for facility managers shows where a building wastes energy, water and money, and what to do about it.
Read more
Building analytics software for engineers, with live twins and real control
Building analytics software for engineers turns meter, sensor and controller points into diagnosis.
Read more
An ESG data platform for buildings, built on metered and verified data
An ESG data platform for buildings collects the water, energy, carbon and air data that sustainability reports depend on.
Read more
Portfolio energy management for real estate, building by building and verified
Portfolio energy management for real estate compares every building on the same basis and directs capital to the worst performers.
Read more
A secure building data platform for CIOs, IT and data teams
A secure building data platform brings meters, sensors and building systems under one governed layer IT can approve.
Read more
How to reduce facility operating costs, with results verified at the meter
Reducing facility operating costs means finding where water, energy and equipment time are wasted and proving each fix.
Read more
A facility operations management platform that acts, then verifies
A facility operations management platform gives operations leaders one view of uptime, losses and response across sites.
Read more
Utility cost management software for CFOs, with savings verified at the meter
Utility cost management software helps finance teams control water, electricity and gas spend.
Read moreSeats that run the buildings
Daily operators who own water, energy, air and uptime.
Facilities managers and directors
Leaks, faults and complaints found, routed to your CMMS and confirmed closed at the meter.
Learn moreBuilding, MEP and controls engineers
Live digital twins of water, electrical and HVAC systems, with the points and protocols behind them.
Learn moreOperations leaders and COOs
Uptime, response and verified fixes across sites, without replacing the CMMS your teams run.
Learn moreSustainability and ESG leads
Metered water, energy, carbon and air data, weather-normalized, ready for the reports your team files.
Learn moreSeats that fund, own and govern them
Owners, approvers and budget holders who need proof, not dashboards.
CFOs and finance teams
Utility spend, bill validation, budgets and savings verified at the meter, not estimated.
Learn moreHeads of real estate and portfolio leaders
Every building ranked on normalized intensity and performance against baseline, across the portfolio.
Learn moreCTOs, CIOs, IT and data teams
Security, integrations, cloud or on-prem deployment and the certifications your review asks for.
Learn moreCEOs and executive leadership
Portfolio outcomes in water, energy and air, measured at the meter and stated in money.
Learn more
The first question each seat asks
“Will this tell my team what to fix, or just add alerts?”
It tells them what, where and why, routes the ticket into your CMMS with evidence, and confirms at the meter that the fix held.
“Can it talk to the equipment I already have?”
Yes. Aqueduct reads BACnet, Modbus, MQTT, M-Bus, pulse and LoRaWAN devices, and controls through relays or field device controllers where control is enabled.
“Will the numbers stand up to an auditor?”
They are metered, weather-normalized and traceable to the device. Aqueduct supplies the evidence; your team or consultant files the report.
“Which buildings should I fix first?”
Sites are ranked on normalized intensity and performance against baseline, so capital goes to the outliers first.
“Is it secure, and where does the data live?”
AWS cloud or on-premises, with ISO/IEC 27001 and SOC 2 Type 2 behind it, and integrations through documented protocols.
“What does this change for the business?”
Energy and water savings are verified at the meter against a weather-normalized baseline, rather than promised in a proposal.
“Will my teams have to change how they work?”
No. Work stays in your CMMS. Aqueduct sends better tickets into it and closes the loop with a meter reading.
“Can I trust the savings number?”
Savings are measured against a weather-normalized baseline and priced with your own utility rates, so the figure reconciles to the bills.
Where each seat usually starts
A first use case per role, and where to go next.
| Seat | Usually starts with | Then reads |
|---|---|---|
| Facilities managers | Reduce water loss | Equipment uptime, restroom monitoring |
| Engineers | HVAC energy optimization | Occupancy-based HVAC control, peak demand |
| Sustainability leads | ESG and sustainability reporting | Water reuse, indoor air quality |
| Real estate leaders | Portfolio benchmarking | Tenant submetering and billing |
| CTO and CIO | Platform security and integrations | On-prem deployment |
| CEO and executives | Portfolio benchmarking | ESG reporting, utility bill validation |
| Operations leaders | Equipment uptime | Reduce water loss, restroom monitoring |
| CFO and finance | Utility bill validation | Peak demand and tariffs, tenant billing |
Where teams put it to work
From alert to verified fix
Facilities managers get leaks and faults located and priced, routed into the CMMS, and confirmed closed when the meter returns to baseline.
Learn more
Utility spend you can reconcile
Finance teams compare billed with metered consumption, split usage from rate changes and see savings measured against a weather-normalized baseline.
Learn more
One platform to approve
IT teams review one secure integration layer for meters, sensors and building systems, deployed in the cloud or on-premises.
Learn moresites in 21 countries run on Aqueduct.
and 9 clinics in one of India’s top hospital chains.
US airport running water intelligence on Aqueduct.
of commercial real estate under Aqueduct.
FMCG manufacturing campus.
operations run on Aqueduct.




Related
Common questions
It is one platform that presents the same facility data differently for each job. In Aqueduct, facilities teams see faults and leaks, engineers see digital twins and points, finance sees validated bills and verified savings, and executives see portfolio outcomes, all from one metered data layer.
Facilities managers, building and controls engineers, sustainability leads, real estate and portfolio leaders, IT and data teams, operations leaders, finance teams and executives. Each seat has its own views and permissions on the same Aqueduct data.
They see the same underlying data with views suited to their role. Landlords and tenants are a clear example: a landlord sees total consumption and each tenant's share of a shared meter, while a tenant sees only its own share.
Usually facilities or operations owns the outcomes, with IT approving security and integrations and finance confirming the savings method. Aqueduct works best when those seats agree on the baseline at the start.
Yes. Portfolio views rank every site on performance against baseline and normalized intensity, and aQ Assistant answers plain-language questions such as how this month compares with the last few, with a data quality note when coverage is low.
No. Facilities teams act on it daily, but finance uses it for bill validation and verified savings, sustainability teams for metered evidence, and IT for a single governed integration layer across building systems.
See Aqueduct on your own facility.
Bring a site, a utility bill or a question. We will show you where the loss is.