Load disaggregation for commercial buildings and plants.
Load disaggregation splits a site's total energy use into the circuits and assets that consume it, so waste can be traced to a specific load. Aqueduct does it from metered data on a live electrical single line: grid, solar and backup on one side, HVAC, lighting, plugs, services and losses on the other.
Split the whole-site number into loads, so every bit of waste has a name.
Your electrical system drawn as it actually is
- Sources separated
Utility supply, rooftop solar and diesel backup are shown separately, so cost and carbon are attributed.
- Switchboard to feeder
The main switchboard and every feeder appear with kVA, power factor, volts and amps.
- Equipment named
Rooftop units, chillers and process loads appear as named blocks, not anonymous circuits.
Every source and end use in one equation
- Sources equal uses
Grid, solar and backup generation equal HVAC, lighting, plugs, services and losses, in kW, live.
- Losses made visible
System losses and a transformer loss estimate appear as their own term, not hidden in the total.
- Coverage shown honestly
Sub-metering coverage is a visible percentage, and nodes without data are marked plainly.
A named load, a baseline and a ticket
- Baseline per feeder
Each feeder has its own expected profile by hour and day, so unusual load stands out.
- Priced and routed
Excess load is priced through rate configuration and routed into your CMMS with the profile attached.
- Ask in plain language
aQ Assistant answers which feeder changed and how this week compares, without walking the switchboard.
Energy breakdown, before and after Aqueduct
- The bill gives one number for the whole site.
- Waste has no owner because nobody knows which load.
- Grid, solar and generator output are blended together.
- Transformer losses and poor power factor never appear.
- Finding a load means walking panels with a clamp meter.
 The Aqueduct way
- The single line splits that number by source and feeder.
- Every load has a baseline, so waste has a name.
- Each source is metered and shown separately on the twin.
- Losses and reactive power appear as their own terms.
- Ask aQ Assistant which feeder changed and get the evidence.
What energy use looks like without Aqueduct
One meter at the main tells you the total and nothing else.
A single number
The bill says how much the site used. It does not say whether HVAC, lighting, plugs or process loads drove it.
Waste with no owner
Without a breakdown, nobody can be asked to fix a specific load.
Sources mixed together
Grid, rooftop solar and backup generation are not separated, so cost and carbon are hard to attribute.
Losses are invisible
Transformer and distribution losses and poor power factor never show up as a line item.
How load disaggregation works
Powered by aQ EnergySmart on the aQ Core data layer.
Meter the main and the feeders
The main must be metered. Sub-meters on feeders, panels and major equipment then explain the number. Existing meters connect where they emit telemetry.
Draw the single line
The electric digital twin follows the real installation: utility supply, solar, generator, the main switchboard and each distribution feeder.
Close the energy balance
Grid Import plus Solar Gen plus Backup Gen equals HVAC plus Lighting plus Power and Plugs plus Services plus Losses, in active power, with reactive and apparent power alongside.
Show coverage honestly
Sub-metering coverage is shown as a percentage, and nodes without data are marked, so the unmetered remainder is never passed off as a known load.
Rank and act
Loads are compared with their own baselines. Waste is priced and routed, and controllable loads can be scheduled where control is enabled.
One load, named
An illustrative case at a mixed-use building.
Main, HVAC feeder, lighting feeder and floor plug meters report into the electric twin.
Each feeder has a baseline by hour and day of week.
Overnight load on the floor two plug feeder is well above its usual floor. Aqueduct names the feeder and prices the excess.
A ticket goes to the CMMS to check the floor for equipment left on, with the load profile attached.
Overnight plug load returns to its baseline, and the saving shows on the feeder and at the main.
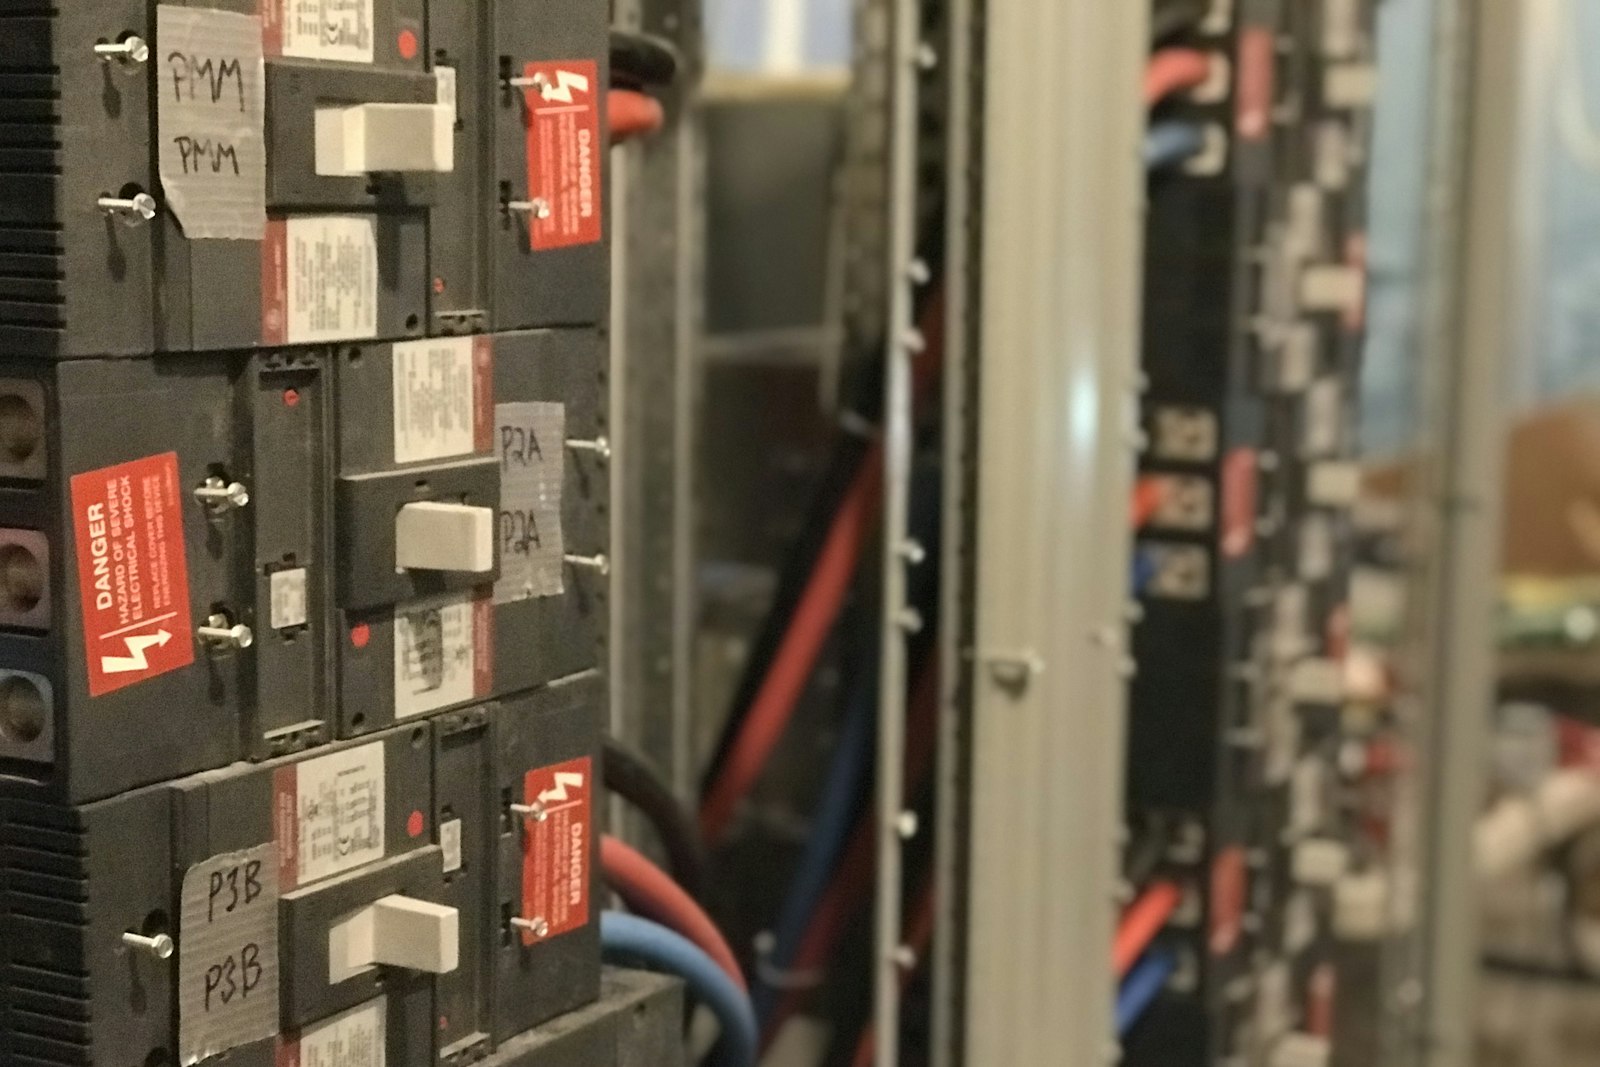
Problem, solution, impact
Total use with no breakdown.
A metered energy balance on the live single line.
Waste traced to a feeder or asset, with a cost on it.
Equipment problems hidden in the total.
Each feeder and asset against its own baseline.
Faulty or misscheduled equipment found by its load.
HVAC energy blamed for everything.
HVAC load separated from lighting, plugs and services.
Ventilation decisions made with their real energy cost.
What you get
Live single line
Sources, switchboard and feeders on the electric twin.
Energy balance equation
Every source and end use in one equation.
Coverage you can trust
Sub-metering coverage and no-data nodes shown plainly.
Loss and power factor
System losses, transformer loss estimate and reactive power per node.
Related standards and terms
Disaggregated data supplies the inputs these frameworks use. Check the current rule.
Where teams put it to work
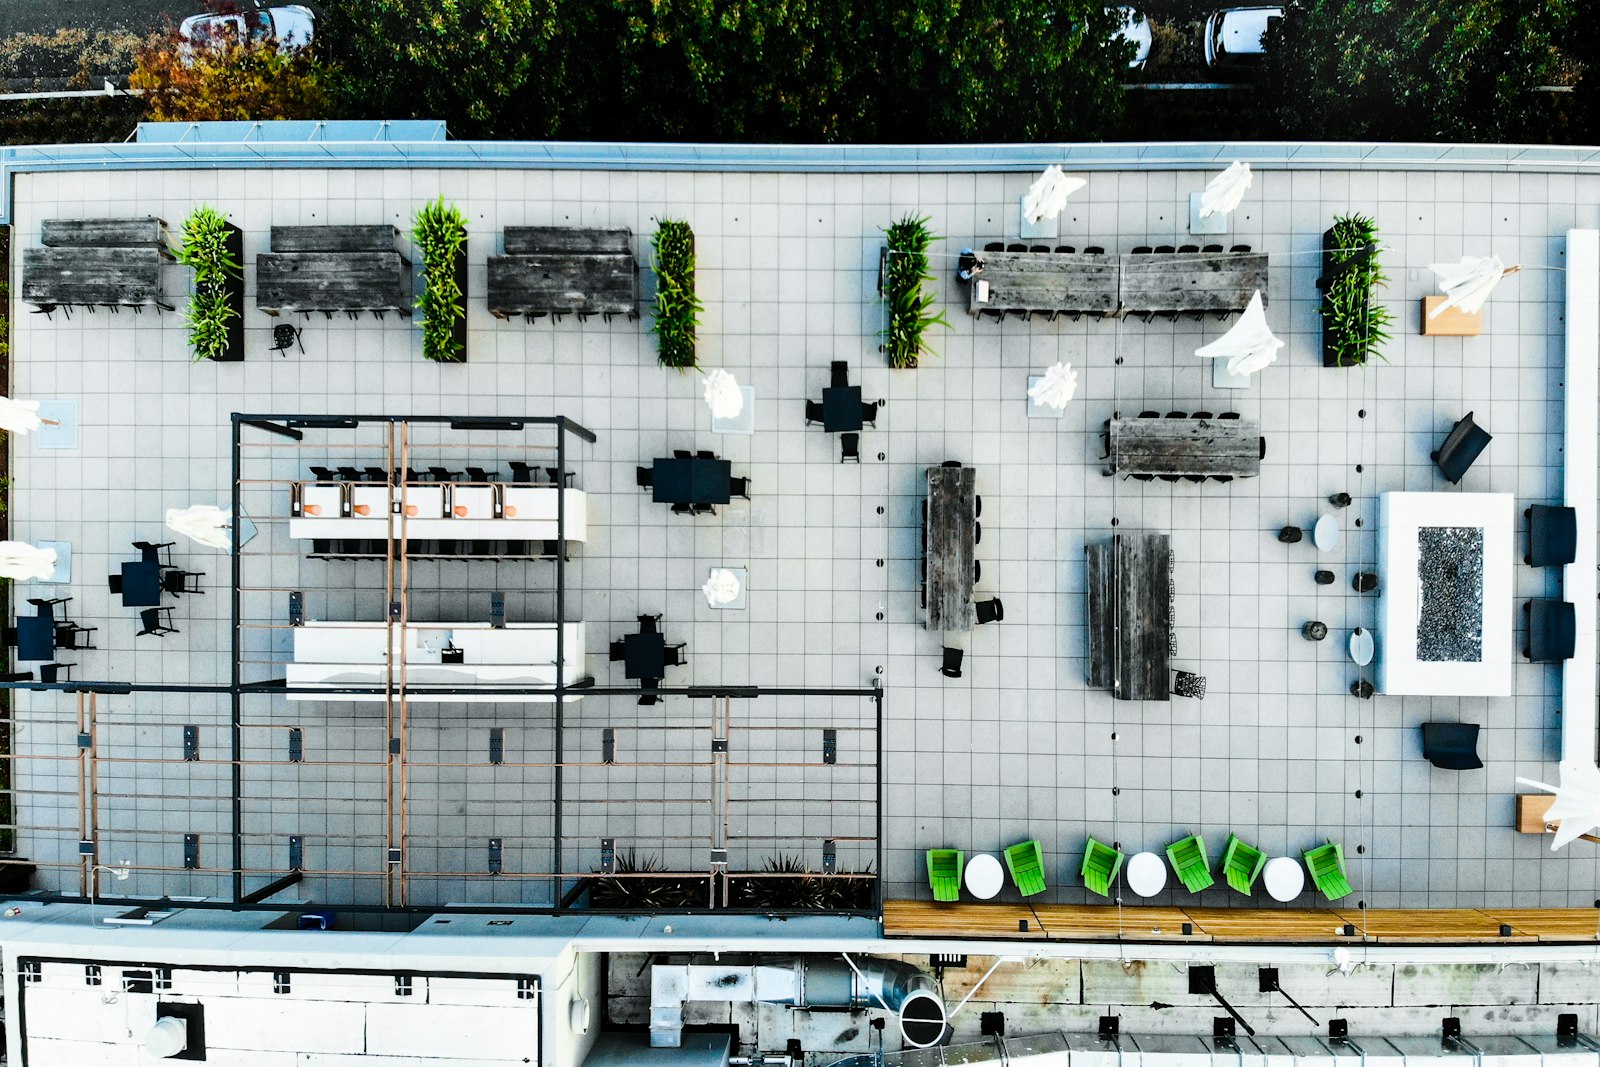
Overnight plug load, found by floor
Floor plug feeders are compared with their own baselines, so equipment left running overnight is traced to the floor that owns it.
Learn more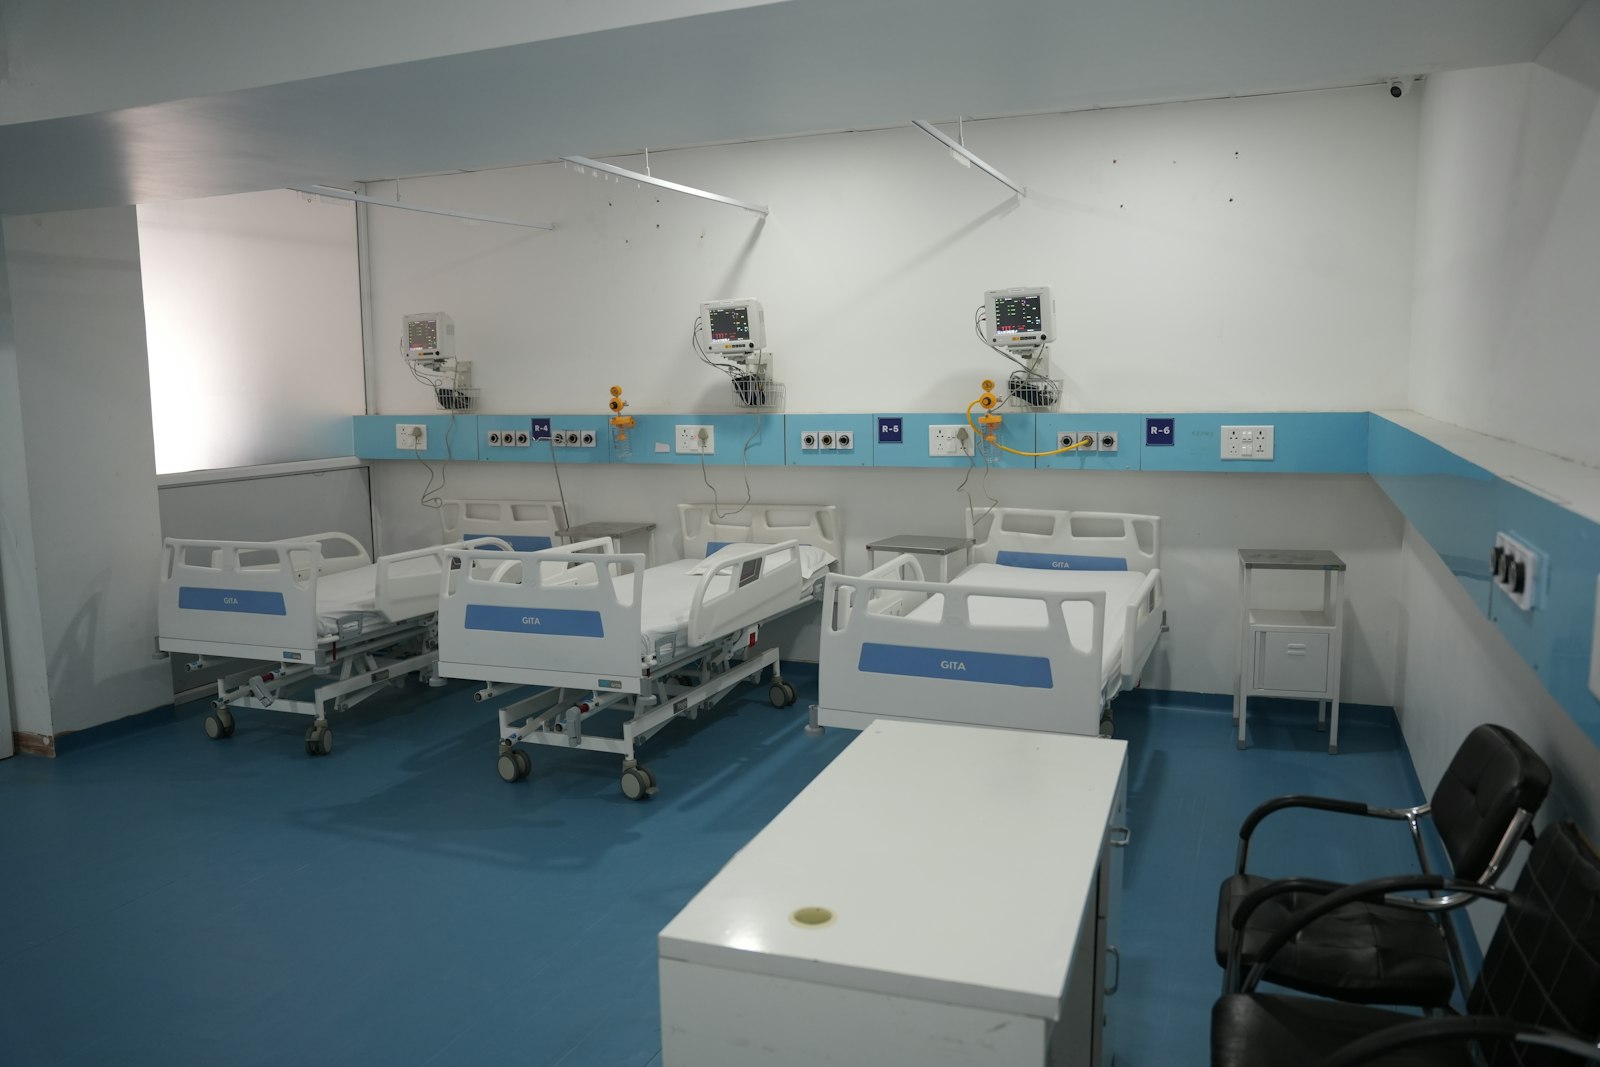
Critical and non-critical loads split
Imaging, sterile processing, HVAC and lighting are metered separately, so savings never touch the loads clinicians depend on.
Learn more
Process energy with a line name
Each production line and its compressed air carry their own load profile, so energy per unit can be tracked by line.
Learn moreRelated
Common questions
It is splitting a site's total energy use into the circuits and assets that consume it, so waste can be traced to a specific load.
No. Aqueduct disaggregates from metered data on feeders and equipment, and shows coverage so you know what is measured and what is not.
Grid import, solar generation and backup generation are separate terms in the energy balance, so each source is attributed.
Yes. Power factor, reactive and apparent power and a power triangle are shown per node, alongside feeder loading.
See Aqueduct on your own facility.
Bring a site, a utility bill or a question. We will show you where the loss is.