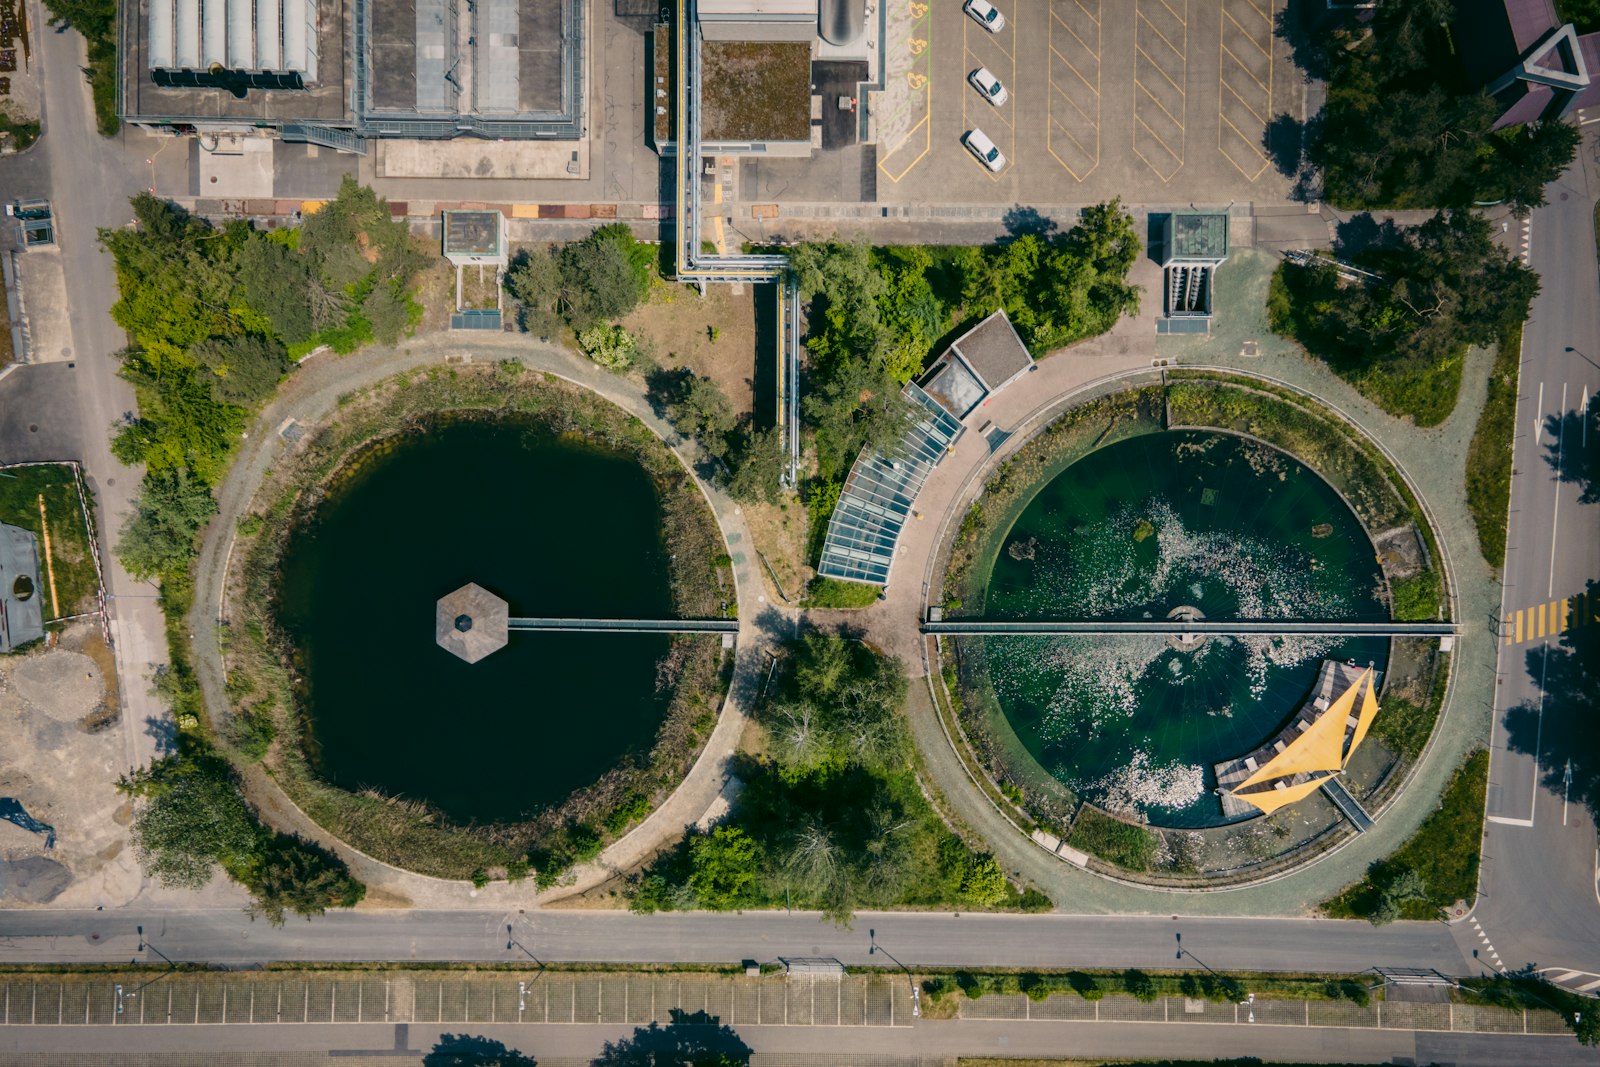
Water and energy utilities that cut network loss they can measure.
Aqueduct reads district metered areas, mains and feeders alongside your SCADA, AMI and historians, localizes the loss and verifies the reduction at the meter. Control stays with SCADA, and the platform can run on premises when data cannot leave.
Find non-revenue water by district, and verify every repair, alongside your SCADA and AMI.
Night flow baselined for every district metered area
- Night flow per district
Minimum night flow is baselined per district, so a rise in real losses stands out within days.
- Loss with an address
Rising loss points to a district and a likely section of main, not just a system total.
- Repairs verified
After the crew leaves, the district balance confirms whether the repair actually brought loss down.
Reads the systems you run, and control stays with SCADA
- Data from every system
Flow and pressure from SCADA, customer reads from AMI and history from the historian sit in one balance.
- Control stays with SCADA
Aqueduct reads utility data and routes work, while operational control remains with your SCADA.
- Work into your CMMS
Repairs route into the utility's CMMS with the district, the evidence and the likely location.
Pump energy and treatment efficiency, measured every day
- Pump station energy
Pump energy is baselined against flow and weather, so efficiency loss and peak demand are visible per station.
- Early signs of failure
Vibration, sound signature and energy drift on pumps schedule maintenance before a station fails.
- Treatment efficiency
Treatment plant efficiency is tracked from live inlet and outlet data, block by block.
Running a utility, before and after Aqueduct
- The annual water audit gives a total, not a location.
- SCADA, AMI and billing data sit in separate systems.
- A main repair is closed when the crew says it is done.
- Pump stations run without an energy baseline.
- Utility data cannot leave the network for a cloud tool.
 The Aqueduct way
- Loss is localized to a district and a section of main.
- SCADA, AMI and historian data reconcile in one balance.
- A repair closes when the district balance confirms it held.
- Every pump station has a baseline for energy and demand.
- Run on-prem, with on-prem AI on NVIDIA infrastructure.
What water and energy utilities teams are up against.
Water, energy, air and operations carry equal weight. Each one runs the same loop: monitor, measure, identify, act, verify.
Water: Non-revenue water with an address
A live water balance per district metered area, so real losses point to a zone instead of a yearly audit figure.
Energy: Pumping energy that follows demand
Pump stations and treatment loads baselined against weather and flow, with savings stated in money.
Air: Plant and control-room air
Treatment buildings and control rooms monitored per zone, with alerts by event type.
Operations: Pumps and assets before they fail
Vibration, sound signature and energy drift on rotating plant, with tickets routed to the CMMS.
Problem, solution, impact.
How Aqueduct resolves each problem for water and energy utilities, and what changes when it does.
A live water balance per district metered area, so real losses point to a zone instead of a yearly audit figure.
A live water balance across meters and sub-meters localizes the loss, routes the fix and confirms it closed at the meter.
Loss found from the balance, not the bill, and every fix verified.
Pump stations and treatment loads baselined against weather and flow, with savings stated in money.
Weather-normalized baselines per building and asset show the waste in money; schedules and setpoints adjust where control is enabled.
Savings stated in money and confirmed at the meter, not estimated.
Treatment buildings and control rooms monitored per zone, with alerts by event type.
Air quality per zone, overlaid with occupancy, with ventilation raised when it matters and verified back in range.
Targets held during occupied hours, with the energy cost counted.
Vibration, sound signature and energy drift on rotating plant, with tickets routed to the CMMS.
Faults diagnosed in plain language and routed into your CMMS with the fix; early signs of failure schedule maintenance first.
Fewer reactive call-outs and closures confirmed by the equipment.
One incident, from first signal to verified fix.
An illustrative example of the flywheel on a typical site.
District meters, pump stations and treatment plants read alongside SCADA and AMI.
A baseline per district, night flow and pump station.
Night flow in District 7 rising above its baseline. Loss localized to one main.
Work order routed into the CMMS with the location and recommended fix.
Night flow back to baseline. Reduction verified and retained as evidence.
Four connected products on one data layer.
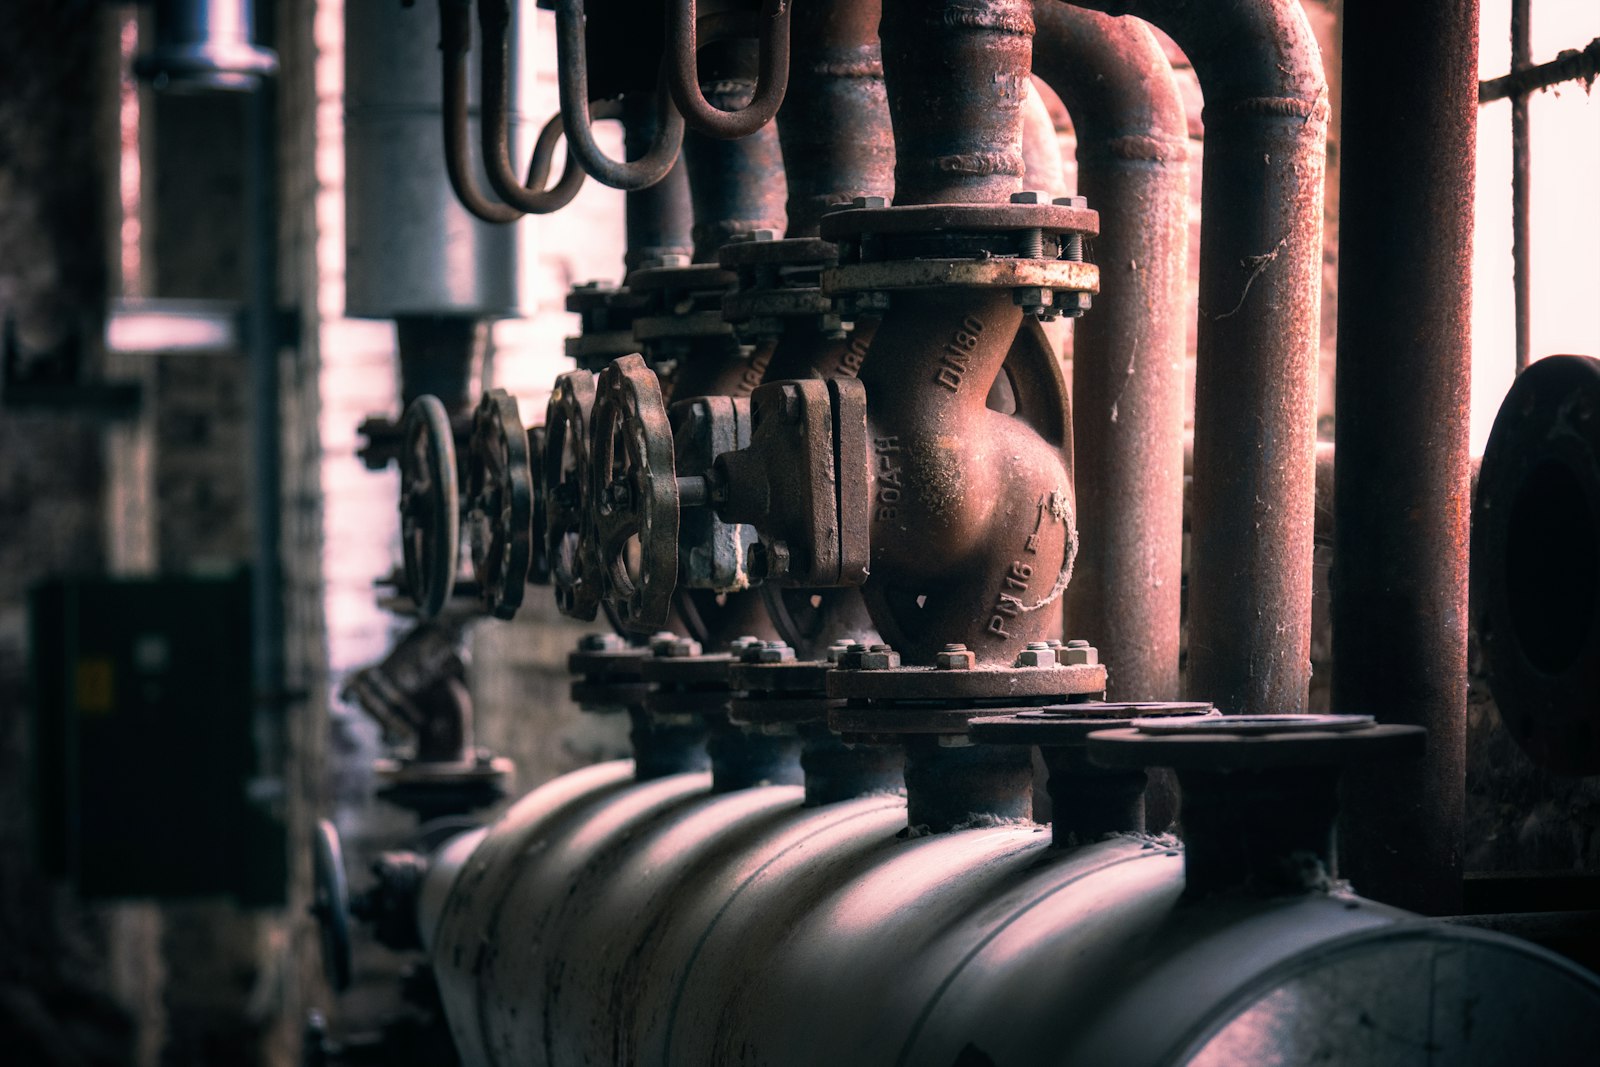
Every gallon a utility treats and pumps should be accounted for, district by district.
Talk to our teamReplace what should be replaced. Connect the rest.
- Water management
- EMS
- Network loss analytics
- SCADA (control stays with SCADA)
- AMI
- Historians
- CMMS and EAM
Three equal ways in: keep your BMS, replace it, or build Aqueduct in at design stage.
The questions each seat asks first.
“Can you cut measurable loss alongside my SCADA?”
“Will the data stay in our environment?”
“Which pumps will fail next?”
Standards and regulations we supply evidence for.
We supply the measured inputs. You run the program and file the report.
Where teams put it to work
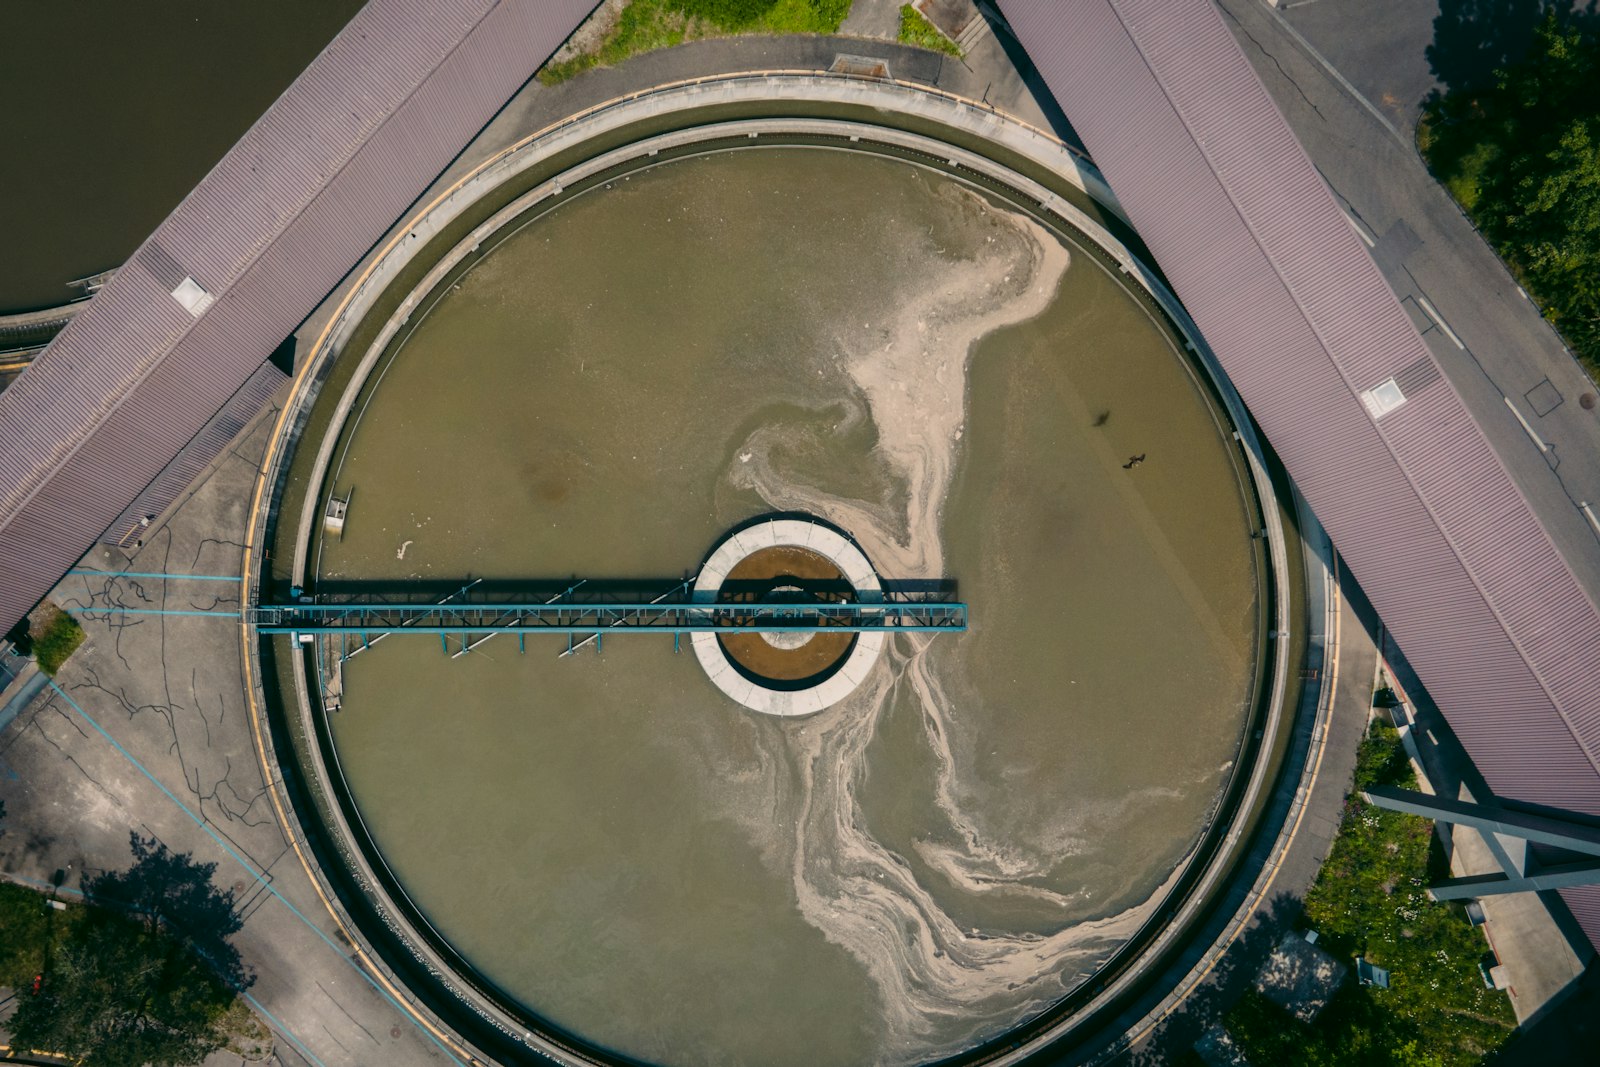
Non-revenue water, found and verified
Real and apparent losses tracked per district metered area, with repairs routed and verified while SCADA keeps control.
Learn more
Network energy and demand, measured
Pump, plant and station loads baselined against weather, so demand and efficiency loss are tracked from measured inputs.
Learn more
Audit volumes measured all year
A live water balance keeps the volumes an AWWA M36 audit needs measured all year, instead of rebuilt at deadline.
Learn moreWhere a water utility loses water and energy
Every liter a utility abstracts, treats and pumps costs energy and chemicals. These are the points where it is lost before it is billed.
Intake and raw water
Raw water abstraction not reconciled with treatment inflow.
Abstraction and plant inlet flow.
Balances source against plant inflow.
Treatment plant
Process water, backwash and losses inside the plant not separated.
Inlet, outlet, backwash and process flows, with block energy.
A plant balance block by block, with treatment efficiency tracked daily.
Reservoirs and tanks
Overflows at night when demand drops and inflow is not throttled.
Level and inflow, read from SCADA.
Flags overflow patterns against level and inflow.
Transmission mains
Large leaks on trunk mains that run for months.
Flow at each end of the main.
Balances inflow against outflow per section.
Booster pump stations
Pumps off their best efficiency point, and running at peak tariff hours.
Pump energy, flow, pressure and run state.
Wire-to-water efficiency per station, and peak demand tracked.
District metered areas
Background leakage and bursts on mains and service connections.
DMA inlet flow and pressure.
Night flow baselined per district, so a rise has an address.
Customer meters
Meter under-registration and data errors that turn into apparent losses.
AMI reads aggregated per DMA.
Compares DMA inflow with billed use to separate real from apparent loss.
Wastewater lift stations
Pumps cycling excessively, and infiltration raising pumped volumes in wet weather.
Pump energy, run hours and wet well level.
Flags excessive cycling and rain-driven infiltration.
Wastewater treatment
Aeration blowers running at more air than the process needs.
Blower energy and process points.
Baselines aeration energy against load.
Every term in the balance, and how each gets measured
The standard water balance in AWWA Manual M36 splits system input into authorized use and losses. Aqueduct keeps that balance live, district by district.
| Component | What it includes | How Aqueduct measures it |
|---|---|---|
| System input volume | Water put into the system from own sources and imports | Plant outlet and import meters, read alongside SCADA |
| Billed authorized consumption | Metered and unmetered water that is billed | AMI and billing data aggregated per district |
| Unbilled authorized consumption | Firefighting, flushing and the utility's own use | Metered where possible, logged estimates otherwise, kept as named terms |
| Apparent losses | Customer meter inaccuracy, data handling errors and unauthorized use | Billed use compared with DMA inflow patterns, and meter drift trends |
| Real losses | Leakage on mains and service connections, and storage overflows | Night flow per DMA, pressure and reservoir level |
| Non-revenue water | Unbilled authorized use plus apparent and real losses | Calculated per district, every day, with the trend |
Six ways a network shows you where the water goes
No single method finds every loss. Aqueduct combines them on one platform, alongside the SCADA and AMI a utility already runs.
Minimum night flow
When legitimate demand is lowest, most of the flow into a district is leakage. A rise in the night minimum is the earliest sign of a new leak.
- Night flow baselined per DMA
- Legitimate night use, such as large customers, accounted for
- Rises flagged within days
- Measured
- DMA inlet flow, every interval
- Target
- stable or falling night flow
- Aqueduct
- baselines and alerts per district
Pressure management
Leakage rises with pressure. Districts held at more pressure than service needs lose more and burst more often.
- Pressure trends per DMA and zone
- Pressure linked to night flow
- Results of pressure changes verified
- Measured
- pressure at inlet and critical points
- Target
- service pressure, no more
- Aqueduct
- shows the leakage effect of each change
Burst detection
A burst shows as a sudden step in flow and drop in pressure. Fast detection limits the volume lost and the damage done.
- Step changes in flow and pressure detected
- Burst localized to a district
- Alert routed with the location
- Measured
- flow and pressure
- Target
- shorter run time for every burst
- Aqueduct
- detects and routes, control stays with SCADA
Apparent losses
Water delivered but not billed because meters under-read or data is wrong. It looks like leakage unless separated.
- Billed use compared with DMA inflow
- Customer meter drift trends
- Data gaps flagged rather than hidden
- Measured
- AMI reads and DMA inflow
- Target
- billed use that matches delivery
- Aqueduct
- separates apparent from real loss
Storage overflows
Reservoirs that overflow at night lose treated water that never reaches a meter.
- Level and inflow tracked together
- Overflow patterns flagged
- Fixes verified by level and flow
- Measured
- level and inflow from SCADA
- Target
- no overflow
- Aqueduct
- flags overflow events
Pumping energy
Pumping is one of the largest operating costs a utility controls. Pumps off their best efficiency point waste it every hour they run.
- Wire-to-water efficiency per station
- Peak demand per station
- Pump wear trends from energy and vibration
- Measured
- pump energy, flow and head
- Target
- pumping at best efficiency
- Aqueduct
- baselines and drift alerts per pump
One district first, then the network
Utilities start where the data already exists and the loss is known to be high, then extend district by district.
Connect and read
Read SCADA, AMI and historian data, on premises where required. Control stays with SCADA throughout.
First districts
Balances and night flow baselines for a set of pilot DMAs. The first rising districts are flagged.
Find and repair
Work orders routed to the utility's CMMS with district and likely location. Each repair is verified by the district balance.
Pumping and plants
Pump stations and treatment plants added, with energy baselines and wire-to-water efficiency per station.
Water audit with evidence
The annual water audit is built from a year of daily balances, not assembled at year end.
What each team in the utility gets
Network operations
Loss localized to a district and a section of main, with every repair verified.
Learn moreAsset management
Pumps ranked by efficiency loss and early signs of failure, so replacement is planned.
Learn moreEnergy and finance
Pumping energy per station, peak demand tracked, and savings stated in money.
Learn moreIT and security
On-premises deployment, read-only integration with SCADA, and data that stays in your environment.
Learn moreSources1 references cited on this page
Proven in live sites.
Anonymized results, verified at the meter.
in 21 countries run on Aqueduct
Features that matter here
Common questions
No. Aqueduct works alongside SCADA, AMI and historians. It reads network data and control stays with SCADA.
Yes. Aqueduct can be deployed on premises with AI on NVIDIA infrastructure for data that cannot leave.
It keeps a live water balance per district metered area and flags rising night flow, so a loss is localized to a zone and a main.
Large customers and known night users are metered or modeled as named terms in each district's balance. What remains in the night minimum is treated as likely leakage, and tracked against its baseline.
Yes. Billed and AMI use is compared with district inflow over time, and customer meter trends are watched. That splits water that was delivered but not billed from water that never reached a customer.
No. It starts with the district meters, SCADA and AMI already in place. New meters are added only where a balance cannot close without them.
Yes. Each station is baselined against flow and weather, wire-to-water efficiency is tracked, and peak demand is visible. Operational changes stay with your operators and SCADA.
It keeps the balance components in the M36 structure every day, so the annual audit starts from a year of measured data. The utility completes and files the audit.
See Aqueduct on your own facility.
Bring a site, a utility bill or a question. We will show you where the loss is.