Building portfolio energy benchmarking that ranks sites and drives action
Building portfolio energy benchmarking compares sites on a fair basis to find the ones that waste most. Aqueduct ranks every site on water and energy intensity per square foot and per visitor and on performance against a weather-normalized baseline, highlights top improvers and sites needing attention, and routes action to the outliers. Results are verified at the meter.

Rank every site fairly, fix the outliers first, and verify the gain.
Every site normalized for size, use and weather
- Per square foot and visitor
Water and energy intensity per square foot and per visitor make large and small sites comparable.
- Against its own baseline
Each site is measured against what weather and history say it should use.
- Filters
Filters by site type, region and country keep every comparison like for like across the portfolio.

Top improvers and sites needing attention
- Ranked lists
Sites are ordered by performance against baseline, shown in units or in money from your rates.
- Drill down
From the portfolio to the site, floor and line to see why a site ranks low.
- Water, energy and air
Water, energy and air portfolios share the same structure, all built on one data layer, aQ Core.

Rankings that turn into fixes at the worst sites
- Routed to the site
Findings go to each site's own team through your CMMS, with the location and evidence attached.
- Control where enabled
Schedules and setpoints change where control is enabled, with owner approval, and are logged in command history.
- Verified gain
Improvement is confirmed at the meter before a site moves up the ranking.
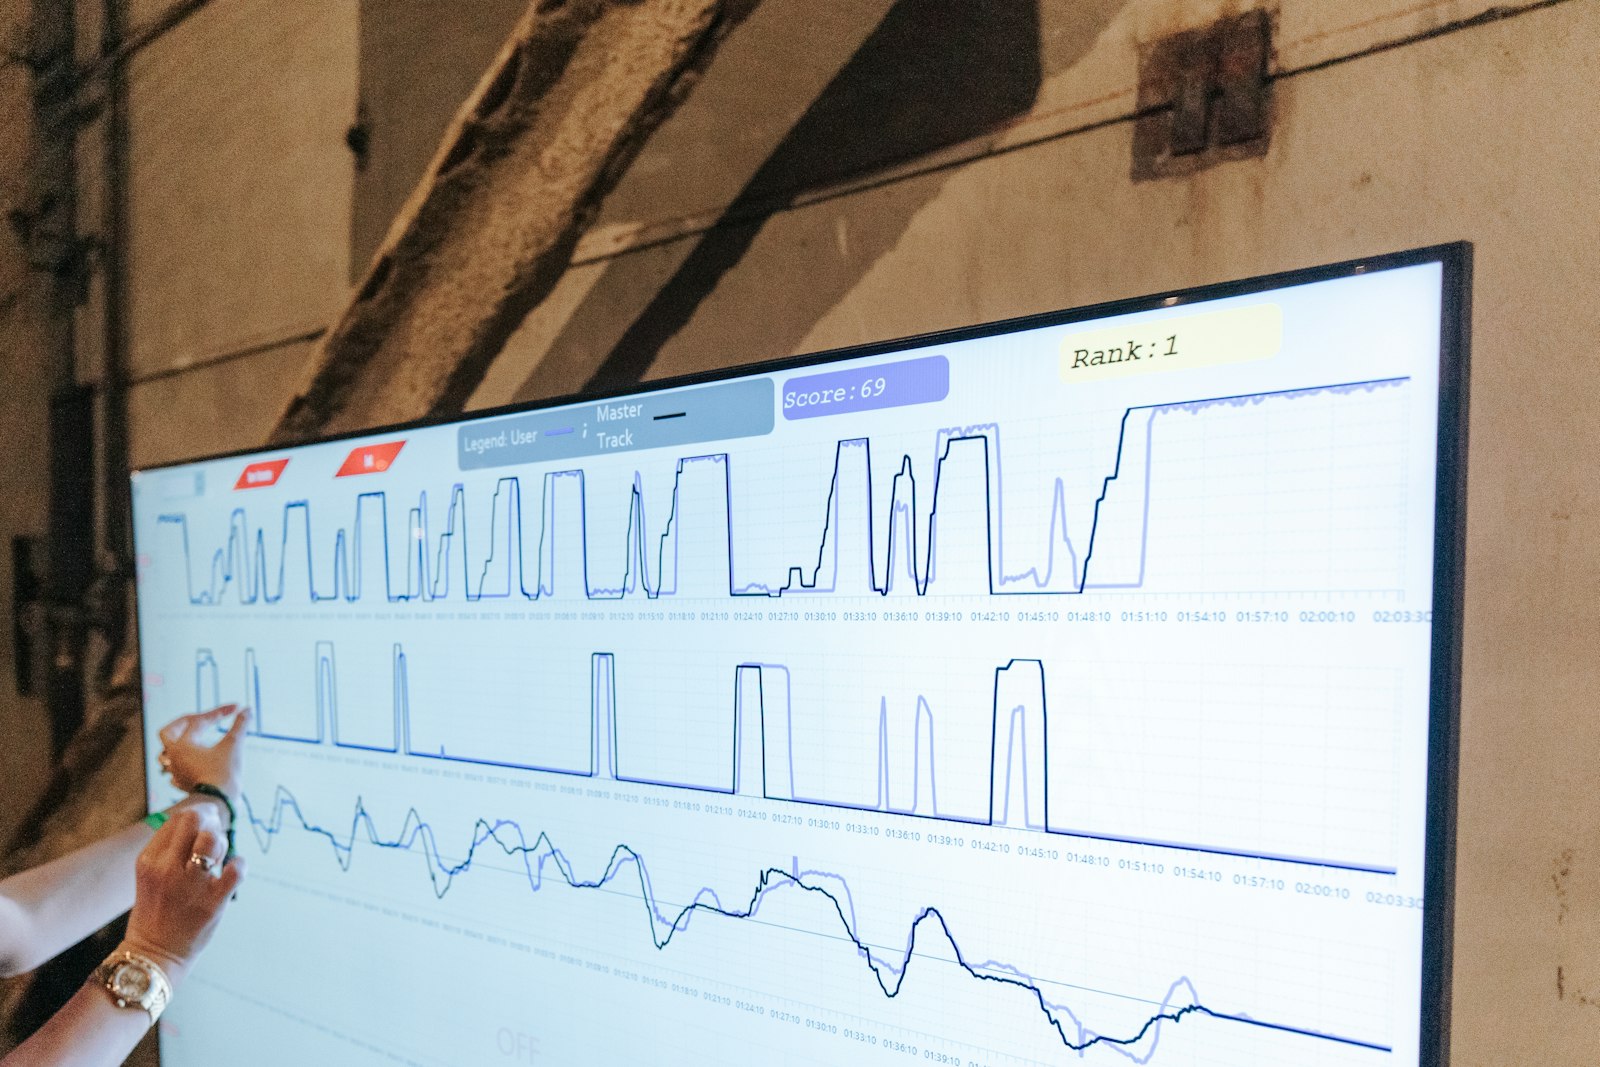
Portfolio benchmarking, before and after Aqueduct
- Sites are compared on raw totals.
- Climate differences make comparisons between sites unfair.
- The benchmark arrives once a year.
- A poor ranking comes with no cause.
- Improvements are reported, but never verified.
 The Aqueduct way
- Sites are compared on normalized intensity.
- Weather-normalized baselines make comparisons between sites fair.
- Rankings update continuously from live meter data.
- Drill-down shows the cause behind each ranking.
- Improvements are verified at the meter.
Why benchmarking rarely changes anything
Most benchmarks are an annual table that nobody acts on.
Raw totals mislead
The largest building always uses most, so raw consumption hides the inefficient small site.
Weather confuses the comparison
Sites in different climates, or the same site in different years, cannot be compared fairly.
Annual, not live
Benchmarks are produced once a year from bills, long after the waste happened.
No path to action
A ranking says a site is poor, but not why or what to fix first.
How Aqueduct benchmarks a portfolio
One quarter, from ranking to verified improvement.
Main meters at every site report water, electricity and gas, with floor area and visitor numbers recorded per site.
Each site gets a weather-normalized baseline, and intensity is calculated per square foot and per visitor.
The portfolio ranking shows three sites far above expected use. Drill-down shows night water flow at one and HVAC schedules at another.
Findings route to each site's team through your CMMS, and control changes are made where enabled with owner approval.
The sites move below baseline, the improvement is verified at the meter, and they move up the ranking.
What it needs on site
Existing meters connect if they emit telemetry. New devices are installed through partners.
| Device | What it measures or does | Why it matters |
|---|---|---|
| Main meters per site | Water, electricity, gas | The basis of every comparison |
| Site attributes | Floor area, visitors, site type, region | Normalization and filtering |
| Utility bills, 6 to 12 months | Historical use and rates | Day-one baselines for every site |
| Sub-meters (optional) | Consumption by floor, line or feeder | Explains why a site ranks where it does |
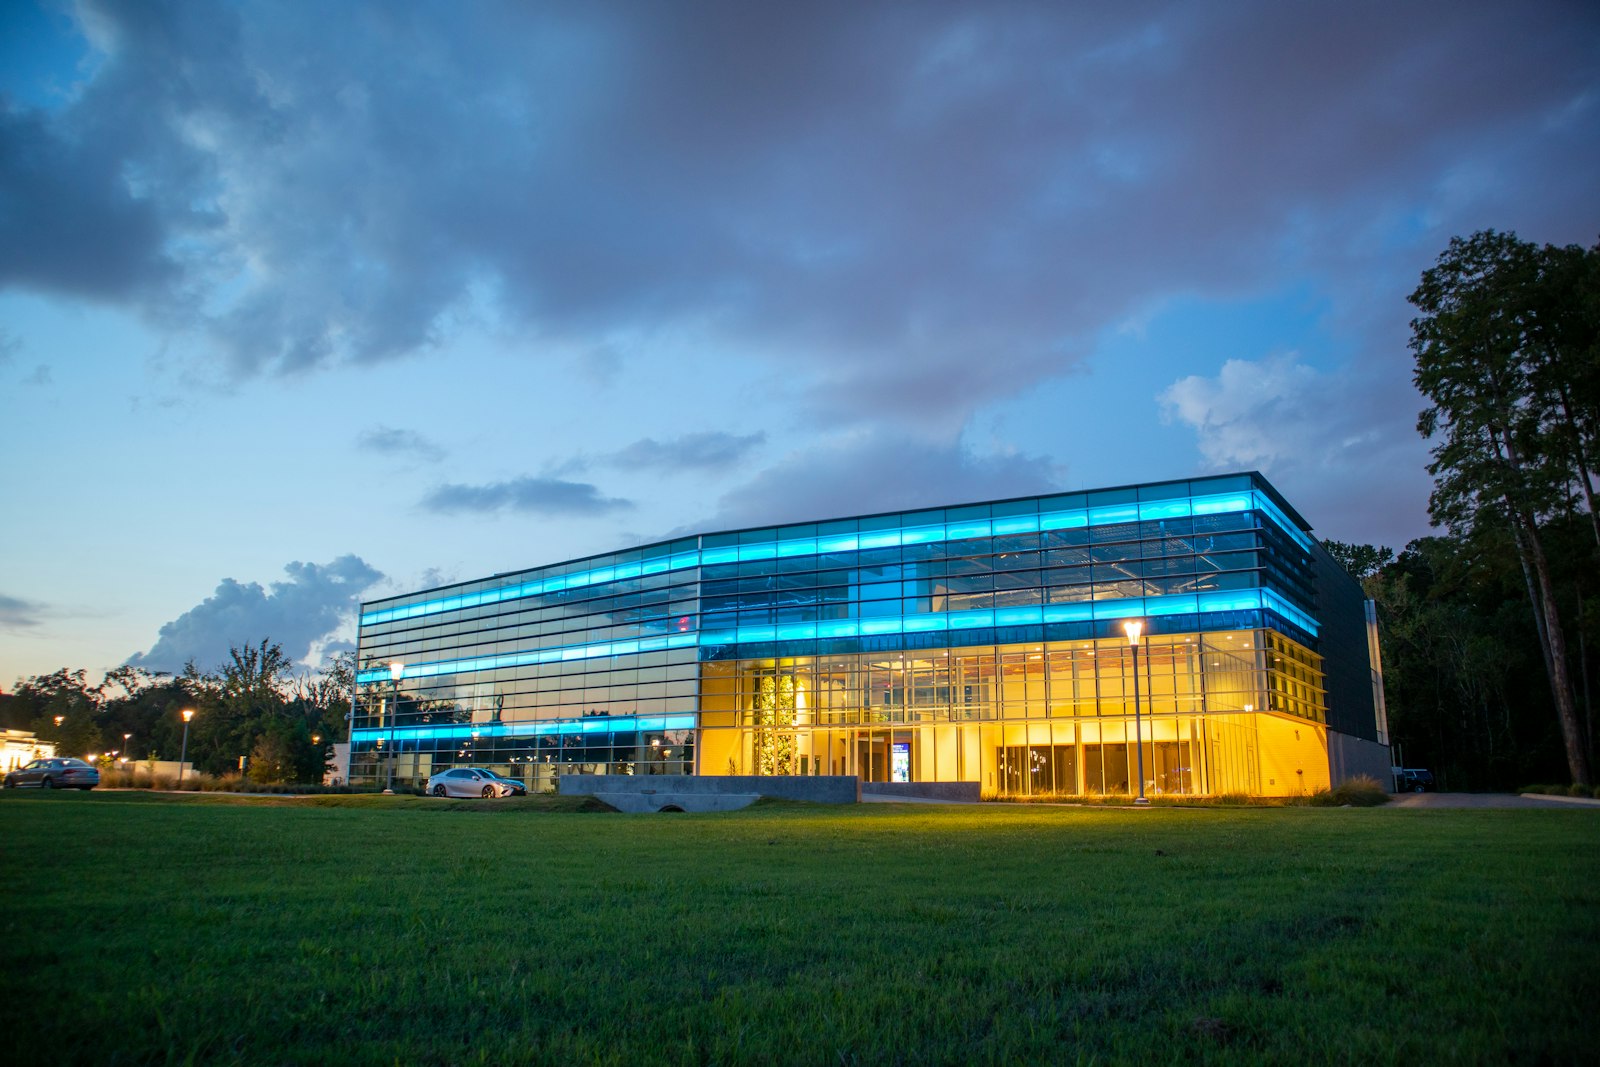
What the portfolio view shows
The same structure across water, energy and air.
| View | Metric | Use |
|---|---|---|
| Water portfolio | Total use, average daily use, water use intensity per sq ft, per visitor | Find water outliers |
| Energy portfolio | Actual versus adjusted baseline, estimated change, energy or cost | Find energy outliers |
| Air portfolio | Peak site average CO2, CO2 exposure in zone-hours, zones monitored | Find air outliers |
| Filters | Top improvers, needs attention, site type, region, country | Focus the review |
Who cares about this
The seats that ask for this first.
Heads of real estate and portfolio leaders
Capital directed to the buildings with the largest gap.
Learn moreWhere teams put it to work
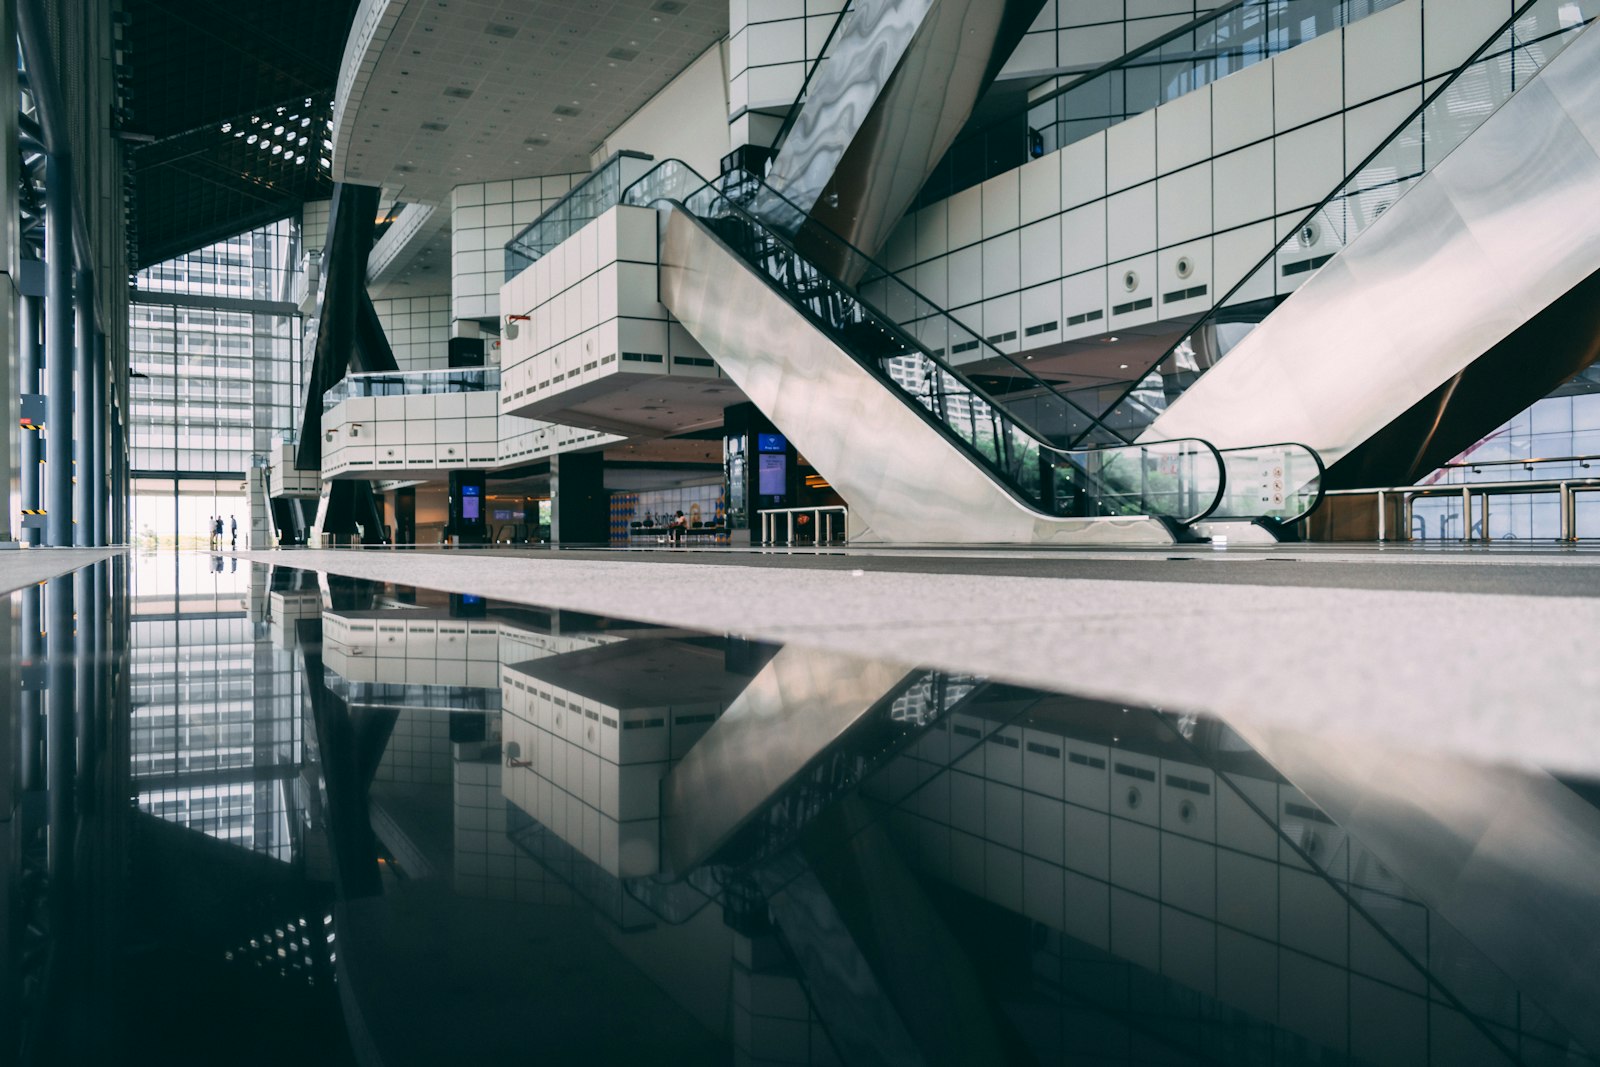
A 20M+ sq ft portfolio ranked
A commercial real estate client with a 20M+ sq ft portfolio ranks buildings on normalized intensity and fixes the outliers first.
Learn more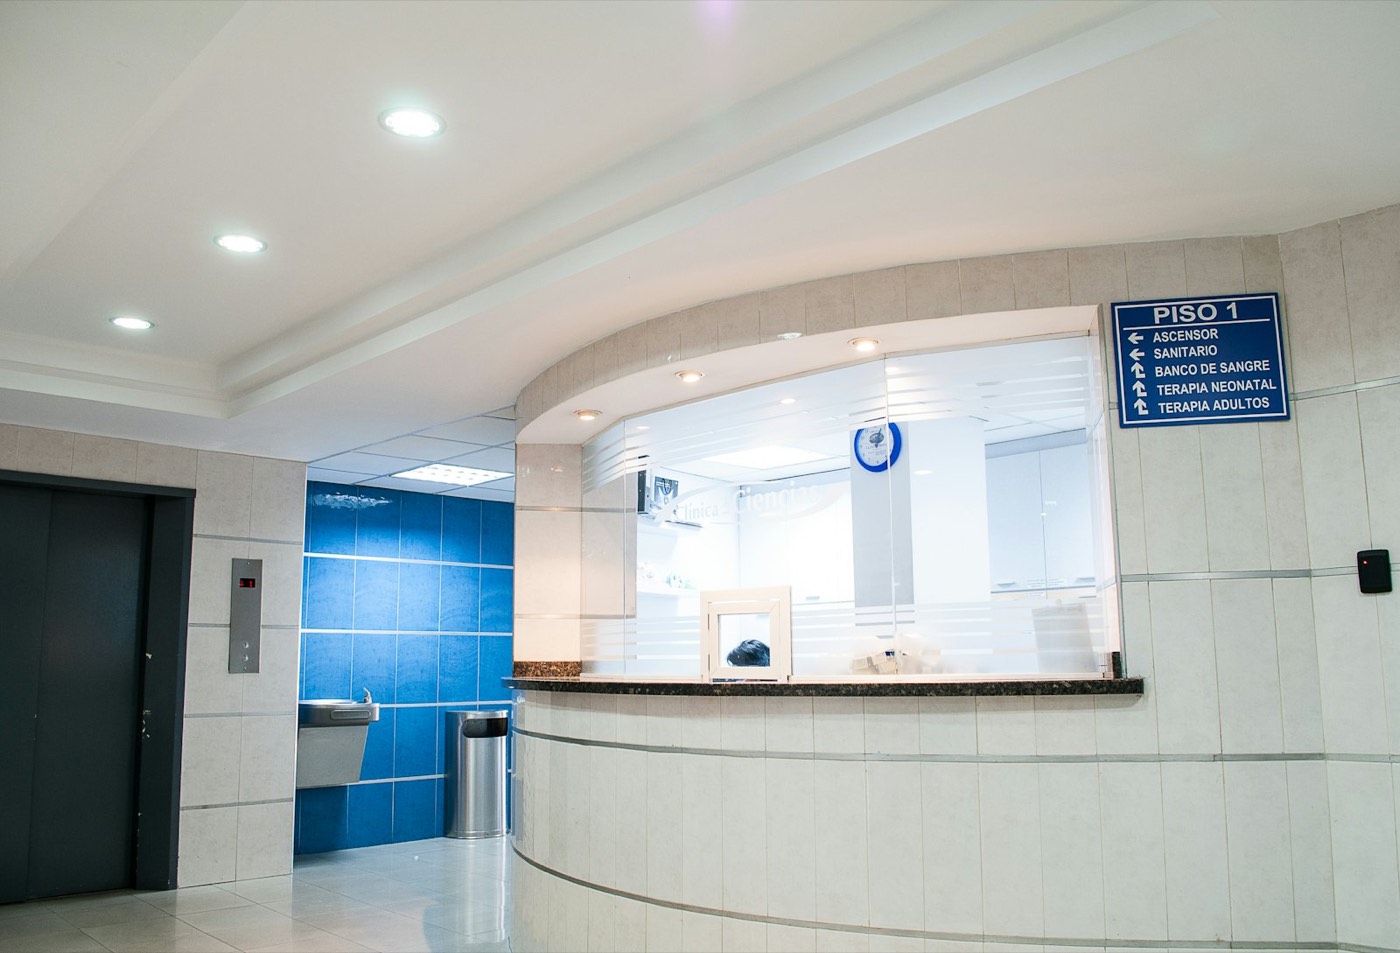
Hospitals and clinics compared
A hospital chain with 22 hospitals and 9 clinics is a client, comparing sites on one basis across water, energy and air.
Learn more
Public buildings benchmarked
Cities and counties benchmark offices, libraries and depots on one basis, with action routed to the worst performers.
Learn moreWhere a portfolio benchmark goes wrong
A ranking is only as fair as its inputs. These are the distortions that put the wrong building at the top of the capital list.
Raw totals
The largest building always looks worst
Floor area and visitors per site
Intensity per square foot and per visitor
Climate
Hot-climate sites look wasteful, mild ones look efficient
Local cooling and heating degree days
Each site against its own weather-normalized baseline
Use type
A data hall and an office compared as equals
Site type attribute
Filters keep comparisons like for like
Partial metering
Unmetered loads look like efficiency
Coverage per site
Shows coverage beside every ranking
Billing periods
Bills on different cycles compared month to month
Metered consumption by calendar period
Aligns periods across sites
Annual cadence
The benchmark arrives a year after the waste
Live meter data
Rankings update continuously
No cause
A poor rank with no explanation
Sub-meters by floor, line, feeder
Drill-down from site to line
Benchmarking is becoming an obligation
the year mandatory NABERS energy disclosure began for large office buildings in Australia
Source: NABERS: supporting industry through the Commercial Building Disclosure expansionlisted Indian companies on the BRSR Core reasonable assurance glide path by FY 2026 to 27
Source: SEBI circular on BRSR Core, assurance and value chain disclosures, 12 July 2023Dubai's target cut in electricity and water demand by 2030, against business as usual
Source: MEED: Dubai updates energy savings targetTurning a ranking into Monday's work
Rank on baseline, not totals
Sort sites by performance against their own weather-normalized baseline, in money from each site's rates.
Check coverage
Before acting on a rank, confirm how much of the site's consumption is metered.
Drill to the cause
Follow the gap from site to floor to line: night water flow, an HVAC schedule, a billing error.
Route and act
Send the finding to the site's own team through the CMMS, with control changes only where enabled, with owner approval.
Re-rank after verification
A site moves up only when the improvement is verified at the meter.
Which yardstick for which question
No single intensity metric suits every portfolio. Pick the one that matches the decision.
| Question | Best yardstick | Why |
|---|---|---|
| Is this building improving? | Its own weather-normalized baseline | Removes weather and keeps the building's own mix |
| Which office is least efficient? | Energy use per square foot, offices only | Size removed, use type held constant |
| Which venue wastes water? | Water use per visitor | Footfall drives restroom and catering use |
| Where should capital go? | Gap against baseline in money | Ranks by value at each site's own rates |
| Which sites need metering first? | Coverage percentage | Low coverage makes every other metric uncertain |
| Where is air quality weakest? | CO2 exposure in zone-hours | Duration in occupied zones, not single peaks |
sites in 21 countries run on Aqueduct.
and 9 clinics in one of India’s top hospital chains.
US airport running water intelligence on Aqueduct.
of commercial real estate under Aqueduct.
FMCG manufacturing campus.
operations run on Aqueduct.





Related
Common questions
It is comparing energy and water performance across a set of buildings on a fair basis to find the worst performers. Aqueduct ranks sites by normalized intensity and by performance against a weather-normalized baseline, then routes action to the outliers.
Normalize consumption by floor area and by visitors. Aqueduct shows water use intensity per square foot and per visitor, and energy intensity, so a large site and a small one can be compared fairly.
Weather drives heating, cooling and some water use. Aqueduct builds each site's baseline by regression on usage plus cooling and heating degree days, so comparisons reflect performance rather than climate.
Uploading 6 to 12 months of utility bills for each site gives a day-one baseline, so sites can be ranked before new metering is installed.
Yes. The air portfolio ranks sites by peak site average CO2 and CO2 exposure in zone-hours, alongside the water and energy portfolios.
Aqueduct is deployed in 275+ sites across 21 countries, and a commercial real estate client with a 20M+ sq ft portfolio uses it to rank and act on its buildings.
Both have a place. Peer comparison on normalized intensity finds structural outliers, while each building's own weather-normalized baseline shows whether it is getting better or worse.
Sites carry a type attribute and can be filtered, so offices are compared with offices and warehouses with warehouses. Intensity can be normalized by floor area or visitors.
Yes. Bills give a baseline and intensity per site in the first week. Sub-metering is then added at the outliers so the rank gains a cause.
No. Aqueduct supplies measured, normalized data that your team or rating assessor can use in those programs.
Monthly works for most portfolios, because rankings update continuously and a month gives enough data to see real change. Critical exceptions surface sooner.
See Aqueduct on your own facility.
Bring a site, a utility bill or a question. We will show you where the loss is.