Public estates that act on waste, and report it with evidence.
County, state and federal facilities: courthouses, offices, depots, campuses and bases. One platform that can replace or connect the building systems an agency runs, act on faults, and verify savings the way performance contracts and audits require.
Act on waste across the public estate, and report it with evidence that holds up.
Baselines and M&V that stand up to review
- Measured baselines
Each facility is baselined against weather from meter data or 6 to 12 months of bills.
- Verified savings
Savings are measured against the adjusted baseline and stated in money, the way performance contracts need.
- Monthly metrics export
Verified metrics export every month, so audit and contract reporting starts from measured numbers.

Which assets are drifting, and what it costs to wait
- Drift ranked
Chillers, boilers and air handlers are ranked by drift from baseline, so backlog decisions rest on data.
- Early signs of failure
Vibration, sound signature and energy drift schedule maintenance before a failure closes a courtroom or office.
- Routed to your crew
Findings arrive in your CMMS with the likely cause and recommended fix, then close when verified.
Use and loss per facility, measured for audits
- Facility water balance
Supply reconciles against measured use per facility, so required water evaluations rest on real numbers.
- After-hours waste
Flow and load at night stand out against baseline, so after-hours waste gets fixed.
- Data on site
Deploy on-prem, with on-prem AI on NVIDIA infrastructure, where agency data must stay on site.
Running a public estate, before and after Aqueduct
- Savings in performance contracts rest on engineering estimates.
- Deferred maintenance is prioritized by whoever complains loudest.
- Water evaluations are built from a year of bills at audit time.
- After-hours load runs unnoticed in courthouses and offices.
- Each facility runs a different system with different reports.
 The Aqueduct way
- Savings are measured against an adjusted baseline and verified at the meter.
- Deferred maintenance is ranked by measured drift and cost.
- Water evaluations rest on measured use per facility.
- After-hours load is flagged and corrected with approval.
- Every facility reports the same way on one platform.
What government and public sector teams are up against.
Water, energy, air and operations carry equal weight. Each one runs the same loop: monitor, measure, identify, act, verify.
Water: Water evaluations with real numbers
Use and loss per facility, measured, for required evaluations and audits.
Energy: Verified savings for performance contracts
Baselines and M&V that stand up to review.
Air: Public buildings held to target
Continuous records for occupied spaces.
Operations: Deferred maintenance, prioritized by data
Which assets are drifting, and what it costs to wait.
Problem, solution, impact.
How Aqueduct resolves each problem for government and public sector, and what changes when it does.
Use and loss per facility, measured, for required evaluations and audits.
A live water balance across meters and sub-meters localizes the loss, routes the fix and confirms it closed at the meter.
Loss found from the balance, not the bill, and every fix verified.
Baselines and M&V that stand up to review.
Weather-normalized baselines per building and asset show the waste in money; schedules and setpoints adjust where control is enabled.
Savings stated in money and confirmed at the meter, not estimated.
Continuous records for occupied spaces.
Air quality per zone, overlaid with occupancy, with ventilation raised when it matters and verified back in range.
Targets held during occupied hours, with the energy cost counted.
Which assets are drifting, and what it costs to wait.
Faults diagnosed in plain language and routed into your CMMS with the fix; early signs of failure schedule maintenance first.
Fewer reactive call-outs and closures confirmed by the equipment.
One incident, from first signal to verified fix.
An illustrative example of the flywheel on a typical site.
Meters, BMS points and equipment across county or agency facilities.
A weather-normalized baseline per facility.
Courthouse chiller plant drifting from baseline; after-hours load high.
Schedule corrected with approval. Ticket routed to the facilities crew.
Saving verified at the meter. Evidence retained for the audit.
Four connected products on one data layer.
Public money spent on buildings should come back as savings anyone can verify.
Talk to our teamReplace what should be replaced. Connect the rest.
- BMS and BAS
- Energy management
- Water management
- CMMS and EAM
- IWMS
- ENERGY STAR Portfolio Manager exports
Three equal ways in: keep your BMS, replace it, or build Aqueduct in at design stage.
The questions each seat asks first.
“Can it cover forty buildings with a small team?”
“Will the M&V stand up in a performance contract?”
“How do we buy it, and where does the data live?”
Standards and regulations we supply evidence for.
We supply the measured inputs. You run the program and file the report.
Where teams put it to work
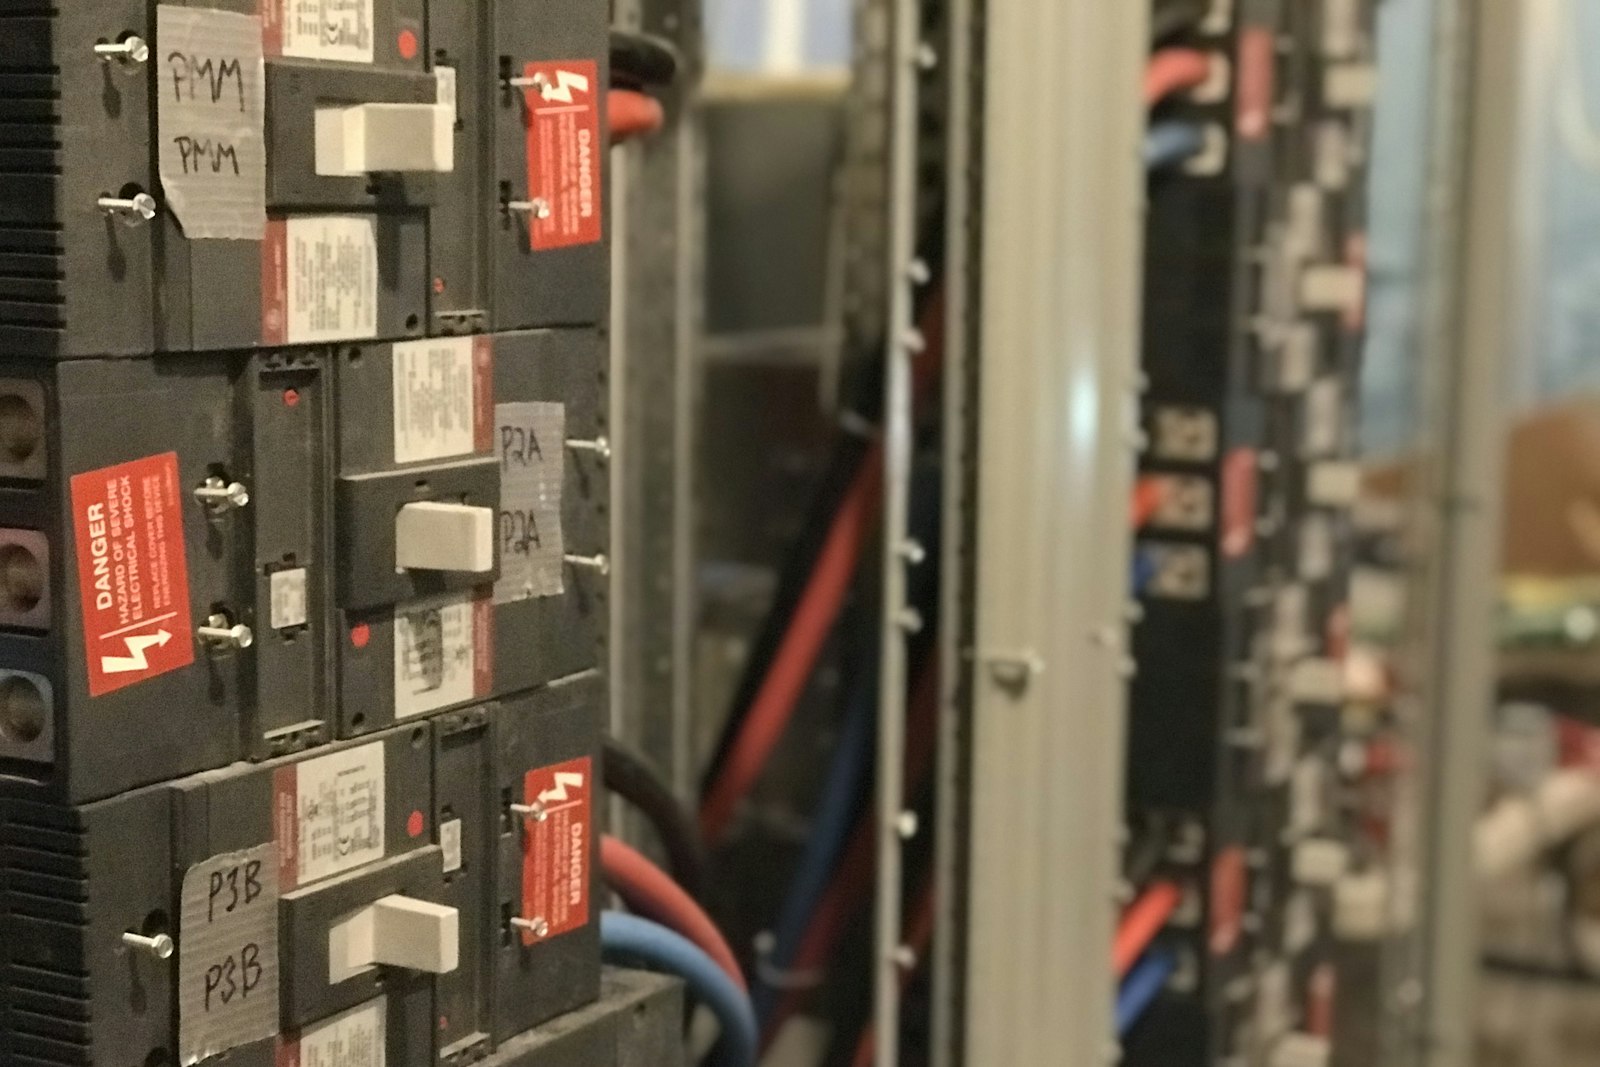
Courthouses, jails and depots on one platform
A small team covers very different buildings, with faults routed, waste ranked and every saving verified at the meter.
Learn more
Evidence instead of engineering estimates
Measured baselines before a project and verified results after it, exported monthly for the audit and the performance contract.
Learn more
Start with one facility
A scoped pilot of one facility or one district, cloud or on-prem, bought through the route your rules allow.
Learn moreDifferent buildings, different risks, one platform
Public agencies run some of the most varied estates anywhere. Each building type has its own operating pattern and its own failure that matters.
Courthouses
Heavy daytime occupancy, secure areas and holding cells, and public spaces that must stay comfortable during long sessions.
- Zone air and comfort in courtrooms
- Plant run hours against court schedules
- Faults found before a session is disrupted
- Measured
- zone conditions, plant energy
- Target
- comfort when in session, minimum when closed
- Aqueduct
- schedule-aware baselines and fault alerts
Agency office buildings
Classic offices where after-hours running and outdated schedules drive most of the waste.
- After-hours plant and lighting
- Water balance per building
- Benchmarking against comparable buildings
- Measured
- building energy and water
- Target
- use that follows occupancy
- Aqueduct
- baselines and after-hours alerts
Maintenance depots and yards
Workshops, vehicle wash and compressed air, often in older buildings with little metering.
- Compressed air leaks found during idle periods
- Vehicle wash water metered
- Workshop heating against occupancy
- Measured
- air, water and energy
- Target
- no idle losses
- Aqueduct
- leak and waste detection
Public laboratories
Labs carry high ventilation loads and conditions that must be held and recorded.
- Lab conditions recorded continuously
- Ventilation energy per lab building
- Freezers and critical equipment alarmed
- Measured
- temperature, humidity, pressure, energy
- Target
- your lab's operating bands
- Aqueduct
- continuous records with alerts
Campuses and installations
Many buildings with their own utility networks, central plants and water mains.
- Campus water and energy balances
- Central plant baselines
- Distribution losses quantified
- Measured
- mains, plant and building meters
- Target
- loss with a location
- Aqueduct
- campus balances and ranked findings
Archives and records storage
Collections that need stable temperature and humidity around the clock.
- Temperature and humidity per storage zone
- Out-of-range alerts
- Records kept for collection care reviews
- Measured
- temperature and RH
- Target
- your preservation band
- Aqueduct
- continuous monitoring and alerting
What public sector rules ask for, and what Aqueduct supplies
Requirements differ by country, level of government and building. Aqueduct supplies measured evidence; agencies, auditors and contract parties make the determination.
| Requirement | What it asks for | What Aqueduct supplies |
|---|---|---|
| US federal energy and water evaluations | Periodic evaluations of covered facilities, with energy and water use measured and benchmarked | Use and loss per facility from meters, with a continuous record between evaluations |
| Energy savings performance contracts | Measurement and verification of guaranteed savings, following FEMP M&V guidance | Weather-adjusted baselines and measured savings for the reporting period |
| IPMVP based M&V | A defined baseline, adjustments and a measurement option | Whole-facility or system-level metering and regression baselines |
| ENERGY STAR benchmarking | Annual whole-building energy and water entered for each building | Measured monthly totals ready for entry |
| State and city performance standards | Measured performance against a limit, with penalties in some places | Measured use and trends, so progress is tracked all year |
| UK public building disclosure and ESOS style audits | Measured energy use and identified improvement actions | Use per building and system, and the record of actions taken |
The systems behind deferred maintenance and wasted budget
Public buildings are often older than their systems' design lives. These are the places where drift becomes cost.
Central plant
Aging chillers and boilers running at poor efficiency and staged for peak all year.
Plant energy, flows and temperatures.
Tracks efficiency against load and ranks plant by drift.
Air handlers
Economizers stuck, dampers failed and fans at full speed.
AHU points from the BMS and fan energy.
Fault detection with likely cause.
Domestic water
Leaks and running fixtures in large, older buildings.
Main and riser meters.
Building water balance and night flow alerts.
Lighting
Lights on after hours and controls overridden.
Lighting circuits per floor.
After-hours load flagged.
Data rooms
Small server rooms cooled hard all year by dedicated units.
Cooling unit energy and room conditions.
Finds overcooling and failing units.
Backup generators
Test runs unrecorded and block heaters running all year.
Run hours and auxiliary energy.
Keeps the test record and counts the auxiliary load.
Irrigation and grounds
Fixed schedules watering through rain.
Irrigation meters with weather.
Flags watering against rainfall.
How measured savings are verified for a performance contract
Set the baseline period
Twelve months of meter data or utility bills before the measures, regressed against weather and, where relevant, occupancy.
Agree the adjustments
Routine adjustments for weather and schedule are built into the model. Non-routine changes, like a new wing, are recorded as they happen.
Measure the reporting period
After the measures are installed, use is measured continuously, not sampled once a year.
Calculate savings
Savings are the difference between the adjusted baseline and measured use, stated in energy, water and money.
Watch persistence
Because measurement is continuous, savings that start to erode show up within weeks, not at the annual report.
From a pilot facility to the whole estate
Agencies usually start with a pilot that answers a procurement or audit question, then extend through the same contract.
Pilot facility
Connect existing meters and the BMS at one facility, on premises where policy requires. Map buildings and zones.
Baselines and findings
Weather-normalized baselines and the first ranked list of faults and waste, routed to the maintenance team.
Verify and report
Savings from first fixes verified at the meter. A short report for the program office and auditors.
Extend across the estate
Further facilities added on the same model, with deferred maintenance ranked by measured drift and cost.
What public agencies ask about first
On premises
Aqueduct can run inside the agency's environment, with AI on NVIDIA infrastructure, where data must stay on site.
Learn moreWorks with what you run
Reads BMS, meters and SCADA over open protocols, and routes work into your CMMS.
Learn moreEvidence, not certification
Measured records for evaluations and audits. Determinations stay with the agency and auditors.
Learn moreProven in live sites across sectors.
Anonymized results, verified at the meter.
sites in 21 countries run on Aqueduct.
and 9 clinics in one of India’s top hospital chains.
US airport running water intelligence on Aqueduct.
of commercial real estate under Aqueduct.
Features that matter here
Common questions
Yes. On-prem AI on NVIDIA infrastructure, for sites that cannot send data out.
Yes. Measurement and verification is the Verify step: a baseline modeled before the claim, and the saving confirmed at the meter.
Installation is delivered through third-party partners. Milvian AI is a product company.
A free site survey of one facility. Bring 12 months of bills or a meter list.
Changes such as new floor area, new equipment or a change of use are recorded as they happen, and the baseline is adjusted according to the M&V plan agreed by the contract parties.
Yes. Plant is ranked by measured drift from its own baseline and by the cost of that drift, so the backlog is prioritized on data rather than on who reported last.
Yes. Main meters, clip-on electrical meters and wireless sensors give a working picture of a building without a BMS. Many depots and small offices start this way.
Usually twelve months, so every season is covered. Where meters are new, utility bills for the same period can be uploaded to build the first baseline.
Yes. Data is the agency's, and it can be exported at any time in standard formats.
See Aqueduct on your own facility.
Bring a site, a utility bill or a question. We will show you where the loss is.