Non-revenue water, found and verified, for water and sewer utilities.
A water utility reduces non-revenue water by measuring real and apparent losses per district metered area and fixing the districts where loss is rising. Aqueduct reads the SCADA, AMI and historian data a utility already has, baselines night flow per district, routes repairs and verifies each one, while keeping AWWA M36 audit volumes measured all year.
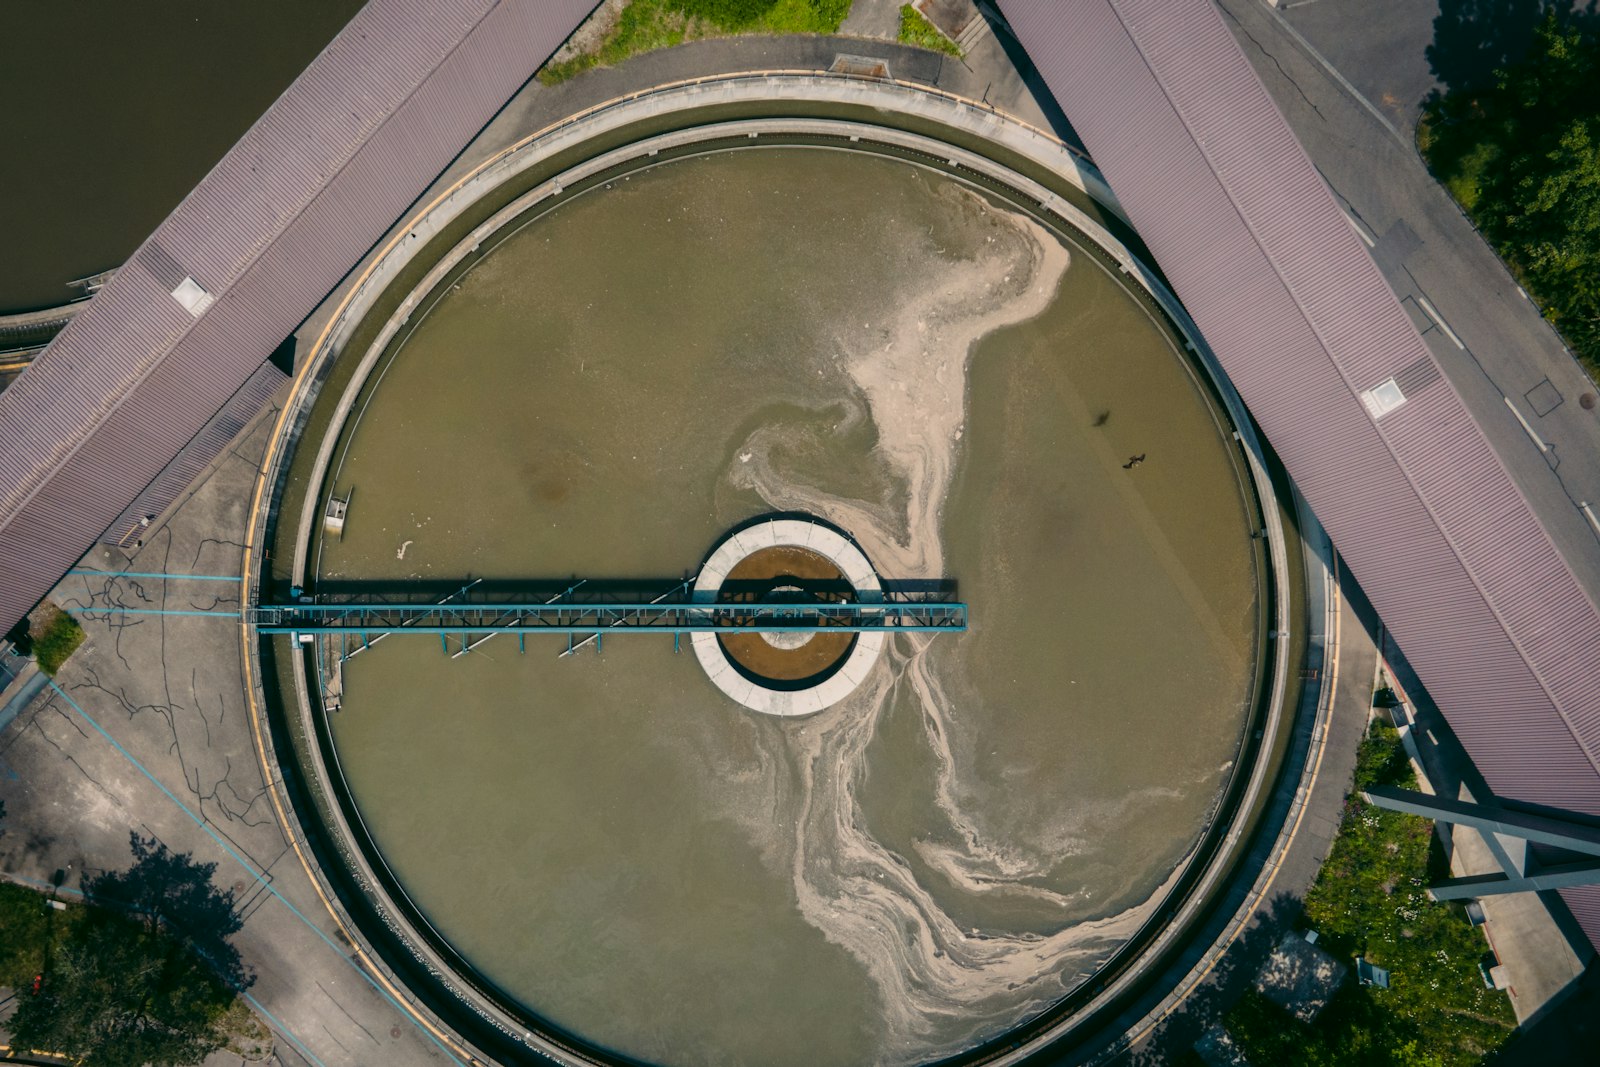
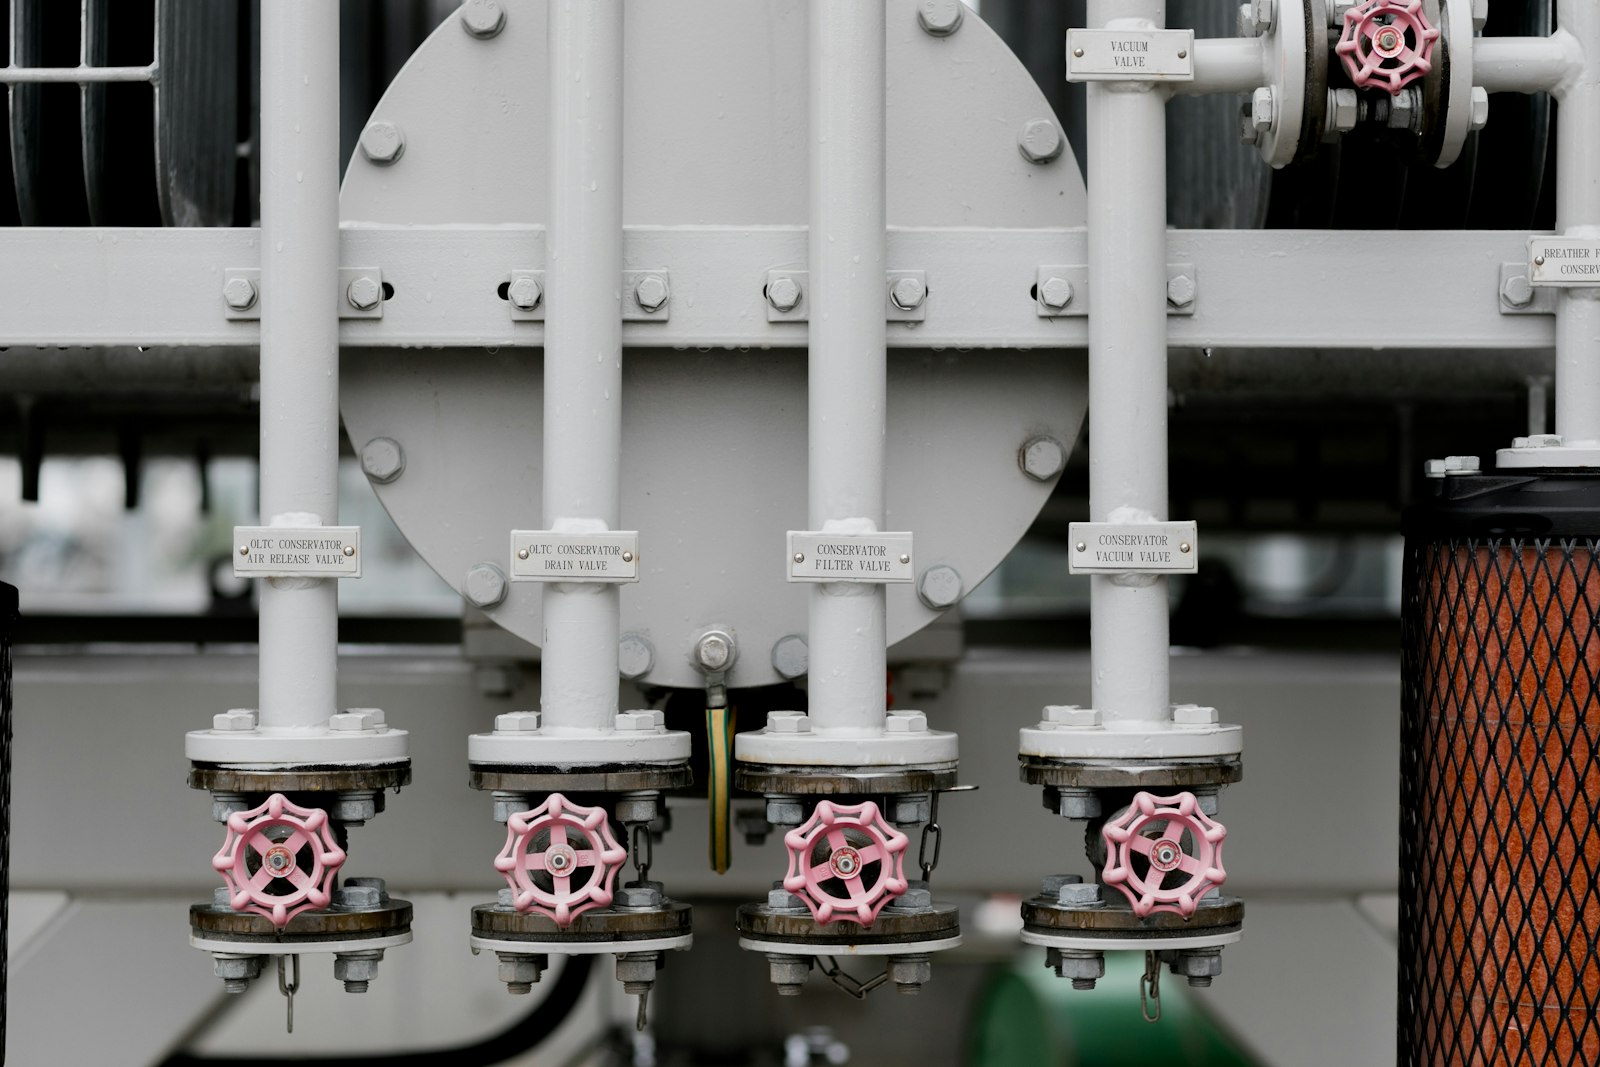
Cut non-revenue water by district, and keep audit volumes measured all year.
Real and apparent losses tracked district by district
- Night flow baselines
Each district metered area is baselined on minimum night flow, so a new leak shows up within days.
- Apparent losses too
Customer meter reads from AMI reconcile against district input, so under-registration and billing gaps surface.
- Repairs verified
The district balance confirms each repair held, so a closed work order means a smaller loss.
Reads SCADA, AMI and historians, and SCADA keeps control
- Many systems, one balance
Flow and pressure from SCADA, reads from AMI and history from the historian sit in one balance.
- Control stays with SCADA
Aqueduct does not operate the network, it reads data and routes work while SCADA keeps control.
- On-prem option
Deploy on-prem, with on-prem AI on NVIDIA infrastructure, so utility data stays inside the network.
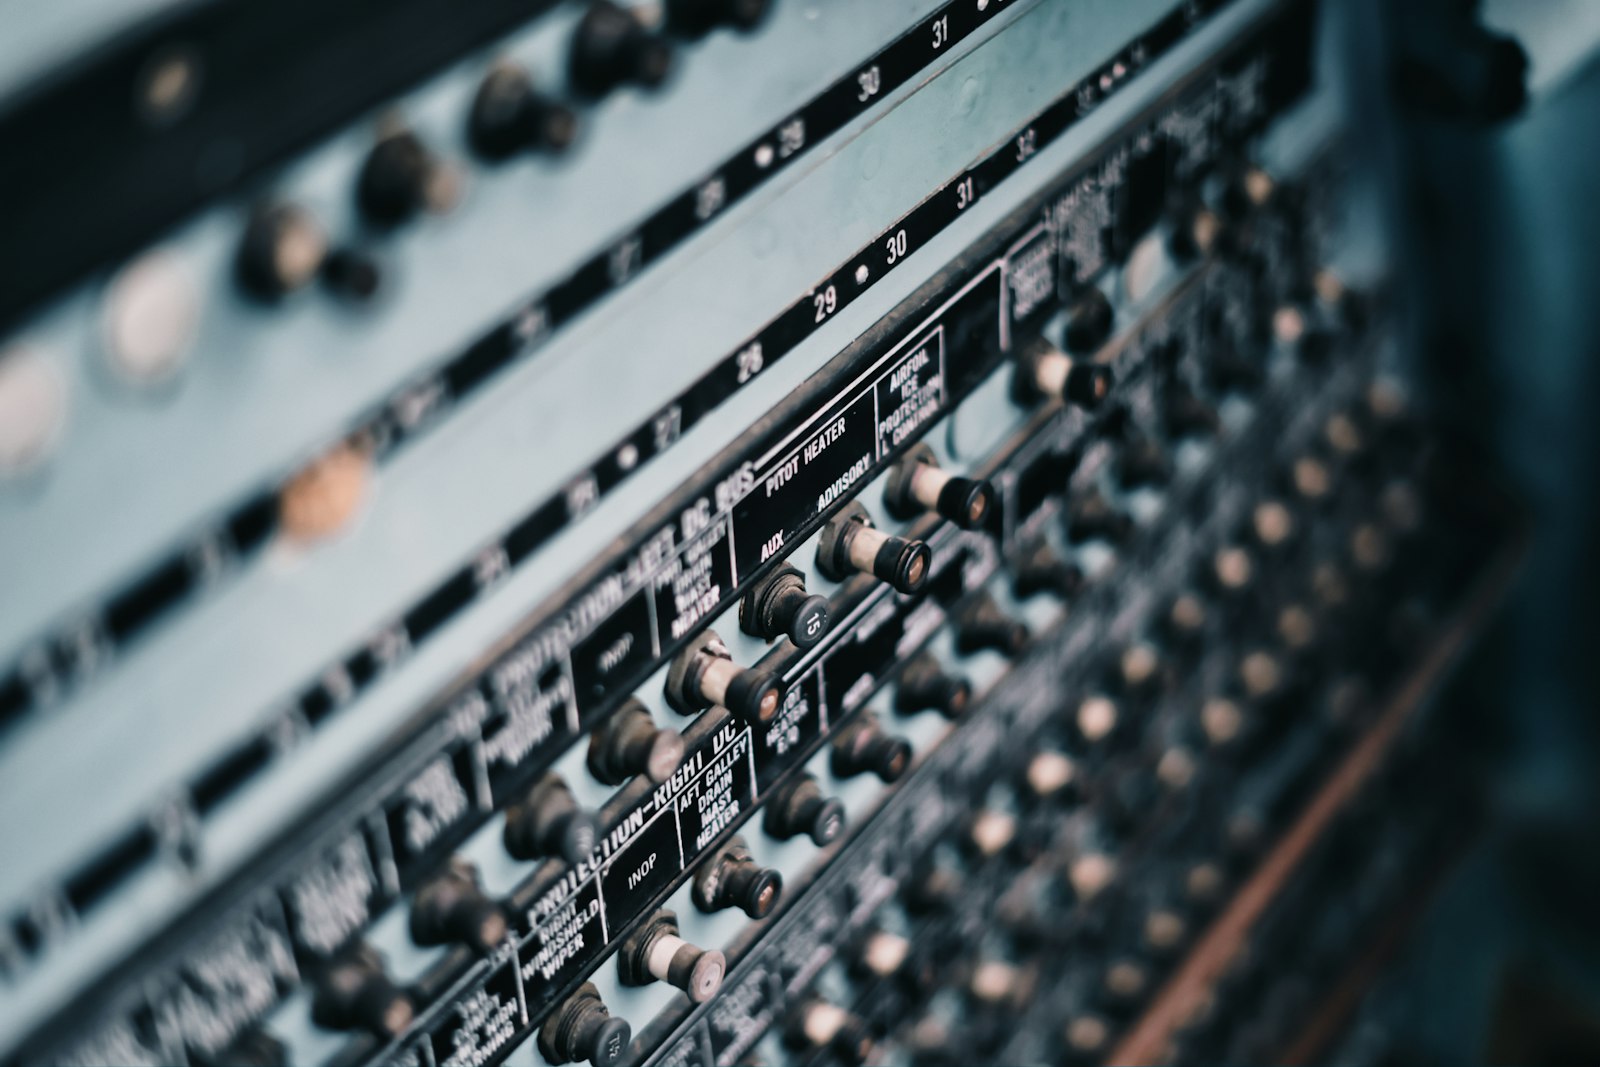
Audit volumes and plant efficiency, measured continuously
- Audit volumes live
System input and authorized consumption are measured all year for the AWWA M36 water audit.
- Treatment efficiency
Treatment plant efficiency is tracked from live inlet and outlet data, block by block.
- Pump stations
Early signs of failure on pumps schedule maintenance before a station goes down.
Running a utility, before and after Aqueduct
- The water audit is a system total rebuilt once a year.
- SCADA, AMI and billing data never meet in one place.
- Crews search a whole pressure zone for one leak.
- Repairs close on the work order, not on the evidence.
- Cloud analytics fail the network security review.
 The Aqueduct way
- Audit volumes are measured all year from a live balance.
- SCADA, AMI and historian data reconcile in one balance.
- Crews go to a district and a likely section of main.
- Repairs close when the district balance confirms the loss fell.
- On-prem deployment keeps utility data inside the network.
Why non-revenue water is hard to cut.
The audit says how much was lost. Operations need to know where, and whether the fix held.
An annual number, not a location
The water audit gives a system-wide total of real and apparent losses. Crews need a district and a section of main.
Data in many systems
SCADA holds flow and pressure, AMI holds customer reads, billing holds volumes. Nobody sees them as one balance.
Repairs nobody verifies
A leak is fixed and the ticket closes. Whether district loss actually fell is rarely checked.
Audit inputs rebuilt each year
Validation turns into a reconstruction exercise because the volumes were not kept measured during the year.
Problem, solution, impact.
Water first on this page, with energy, air and operations on the same platform.
Real losses are known only as an annual total.
Night flow baselined per district metered area, with districts flagged when loss rises above their model. Powered by aQ WaterGuard.
Loss with an address, and each repair verified when night flow returns to baseline.
Apparent losses hide in metering and data handling.
AMI reads compared with district supply, with meters reading outside their usual range flagged.
Candidates for meter testing and data fixes, ranked.
Pumping is often the largest energy cost a utility carries.
Weather-normalized energy baseline per pump station and plant. Powered by aQ EnergySmart.
Energy per volume pumped, tracked and verified after each change.
Pumps and motors fail without warning.
Early signs of failure: vibration, sound signature, energy drift. Tickets routed to your CMMS or EAM.
Maintenance scheduled before the failure, with closure verified.
How it works alongside SCADA and AMI.
Every use case runs the same loop: Monitor, Measure, Identify, Act, Verify. Every verified result becomes the new baseline.
Monitor
Read flow, pressure and level from SCADA and historians, and customer reads from AMI. Add metering where district boundaries need it.
Measure
Build a water balance and a night flow baseline for each district metered area.
Identify
Flag the district where loss rises above its model, and the likely section of main.
Act
Route a work order into your CMMS or EAM with the location and a recommended action. Network control stays with SCADA.
Verify
Confirm the repair when night flow returns to baseline. The measured volumes carry into the annual audit.
Where Aqueduct sits in a utility stack.
Aqueduct reads and correlates. Your systems of record stay in charge of what they do today.
| System | What it keeps doing | What Aqueduct adds |
|---|---|---|
| SCADA | Network control, alarms and operator screens | District balances and night flow baselines from SCADA data. Control stays with SCADA. |
| AMI | Customer meter reads | Customer consumption summed per district and compared with district supply |
| Historian | Long-term time-series storage | Baselines and anomaly detection on the stored history |
| CMMS or EAM | Work orders, crews, inventory | Tickets with a location and a recommended action, and verified closure back |
| Billing and CIS | Customer billing | Out of scope. Billed volumes are an input to the balance. |
Water a utility treats and pumps should reach a customer, or be found.
Talk to our teamWhat a utility gets on one screen.
Built district by district to match the network you actually have.
District water balance
Supply into each district against metered and billed use.
Night flow model
Minimum night flow per district, with rises flagged as they start.
Pump station energy
Energy per station and per volume pumped, baselined for weather.
Asset health
Early signs of failure on pumps and motors, before the outage.
Audit-ready volumes
Measured volumes per district, kept current for the AWWA M36 audit.
On-prem deployment
On-prem AI on NVIDIA infrastructure, where data must stay on site.
The questions each utility seat asks.
“Across my network, alongside SCADA and meters, can I cut measurable loss?”
Yes. Aqueduct reads the data you already have, localizes loss per district and verifies each repair at the meter.
“Will this help my annual audit?”
It keeps the measured volumes per district current all year. Your team completes, validates and files the audit.
“Does it touch my SCADA control?”
No. It reads network data. Control stays with SCADA.
“Where does the data live?”
Cloud or on-prem. On-prem AI on NVIDIA infrastructure for utilities that keep operational data on site.
What it replaces and what it connects.
- Water loss analytics
- Energy management for plants and pump stations
- FDD
- M&V
- SCADA (read data; control stays with SCADA)
- AMI
- Historians
- CMMS and EAM
- GIS as context
Utility billing and CIS are out of scope. Hardware installation is delivered through partners.
Terms and rules utilities ask about.
Each links to its glossary entry.
Where teams put it to work

A district and a section of main
Rising night flow points crews to a district and the likely section of main, with the work order routed to your CMMS.
Learn more
Audit inputs that stay current
The volumes an AWWA M36 audit needs are measured all year, so audit validation starts from data rather than estimates.
Learn more
Inside your network, beside SCADA
Aqueduct reads SCADA, AMI and historian data while control stays with SCADA, and deploys on-prem with on-prem AI on NVIDIA infrastructure.
Learn moreRelated
Common questions
Water that enters the distribution system but does not earn revenue: real losses from leaks, apparent losses from metering and data errors, and unbilled authorized use. Aqueduct measures it per district so it has a location.
No. It works alongside your SCADA, AMI and historians and reads their data. Control of the network stays with SCADA.
District metering makes loss easier to localize. Aqueduct can baseline the districts you have and show where added metering would help. Installation is through partners.
No. It supplies continuously measured volumes per district for each line of the balance. Your team completes, validates and files the audit.
Yes. Aqueduct can run on-prem, with on-prem AI on NVIDIA infrastructure.
Aqueduct is deployed in 275+ sites across 21 countries, and every water saving is verified at the meter against a weather-normalized baseline.
See Aqueduct on your own facility.
Bring a site, a utility bill or a question. We will show you where the loss is.