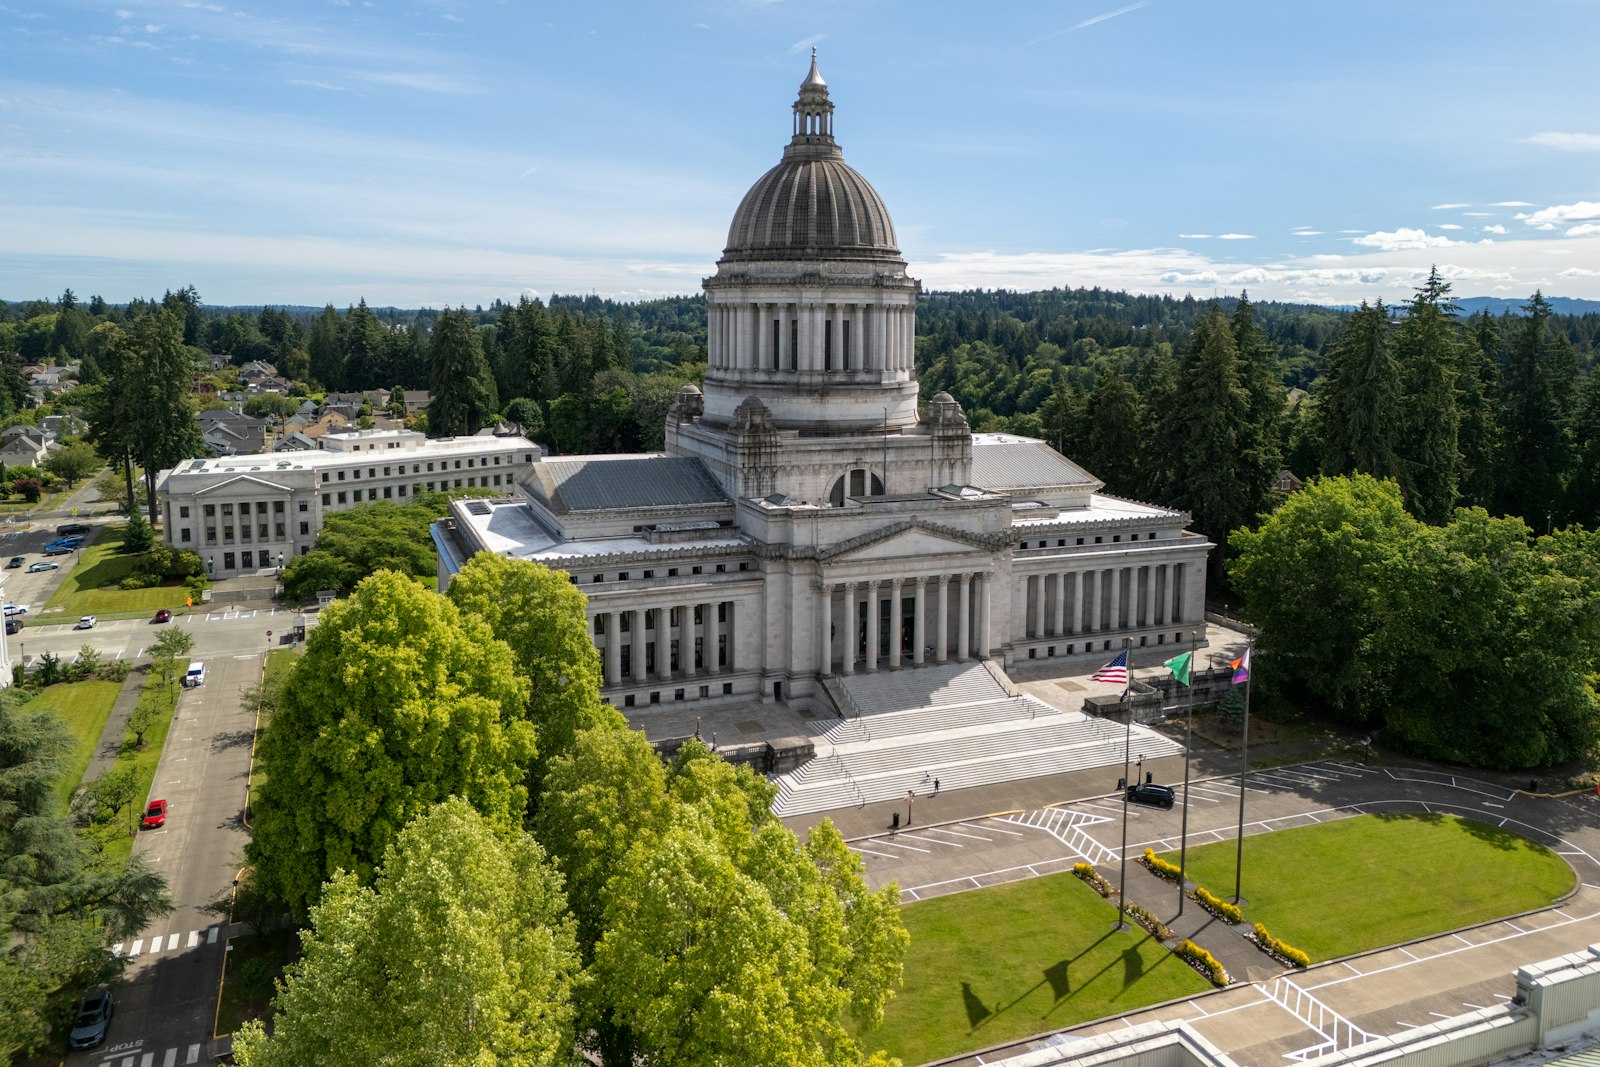
Cities that find their water loss, cut public building energy, and can show residents the numbers.
City halls, depots, libraries, pools, pumping stations and the water network that feeds them. Aqueduct works alongside the SCADA and meters a city already runs, cuts losses that can be measured, and keeps data on site where it must stay.
Find water loss by district, cut public building energy, and show residents the numbers.
District by district, supply against metered and billed use
- Loss with an address
Each district is baselined on night flow, so rising loss points to a district and a section of main.
- Alongside SCADA and AMI
Aqueduct reads the SCADA and AMI a city already runs, and control stays with SCADA.
- Repairs verified
Work orders go to the utility crew, and the district balance confirms whether the repair held.
City halls, libraries, pools and depots benchmarked and improved
- Weather-normalized baselines
Every municipal building is baselined against weather, ready for benchmarking and performance rules.
- Bills on day one
Upload 6 to 12 months of bills and the baseline is ready without waiting a full season.
- Savings in money
Rate configuration turns each building's difference from baseline into money for the council report.
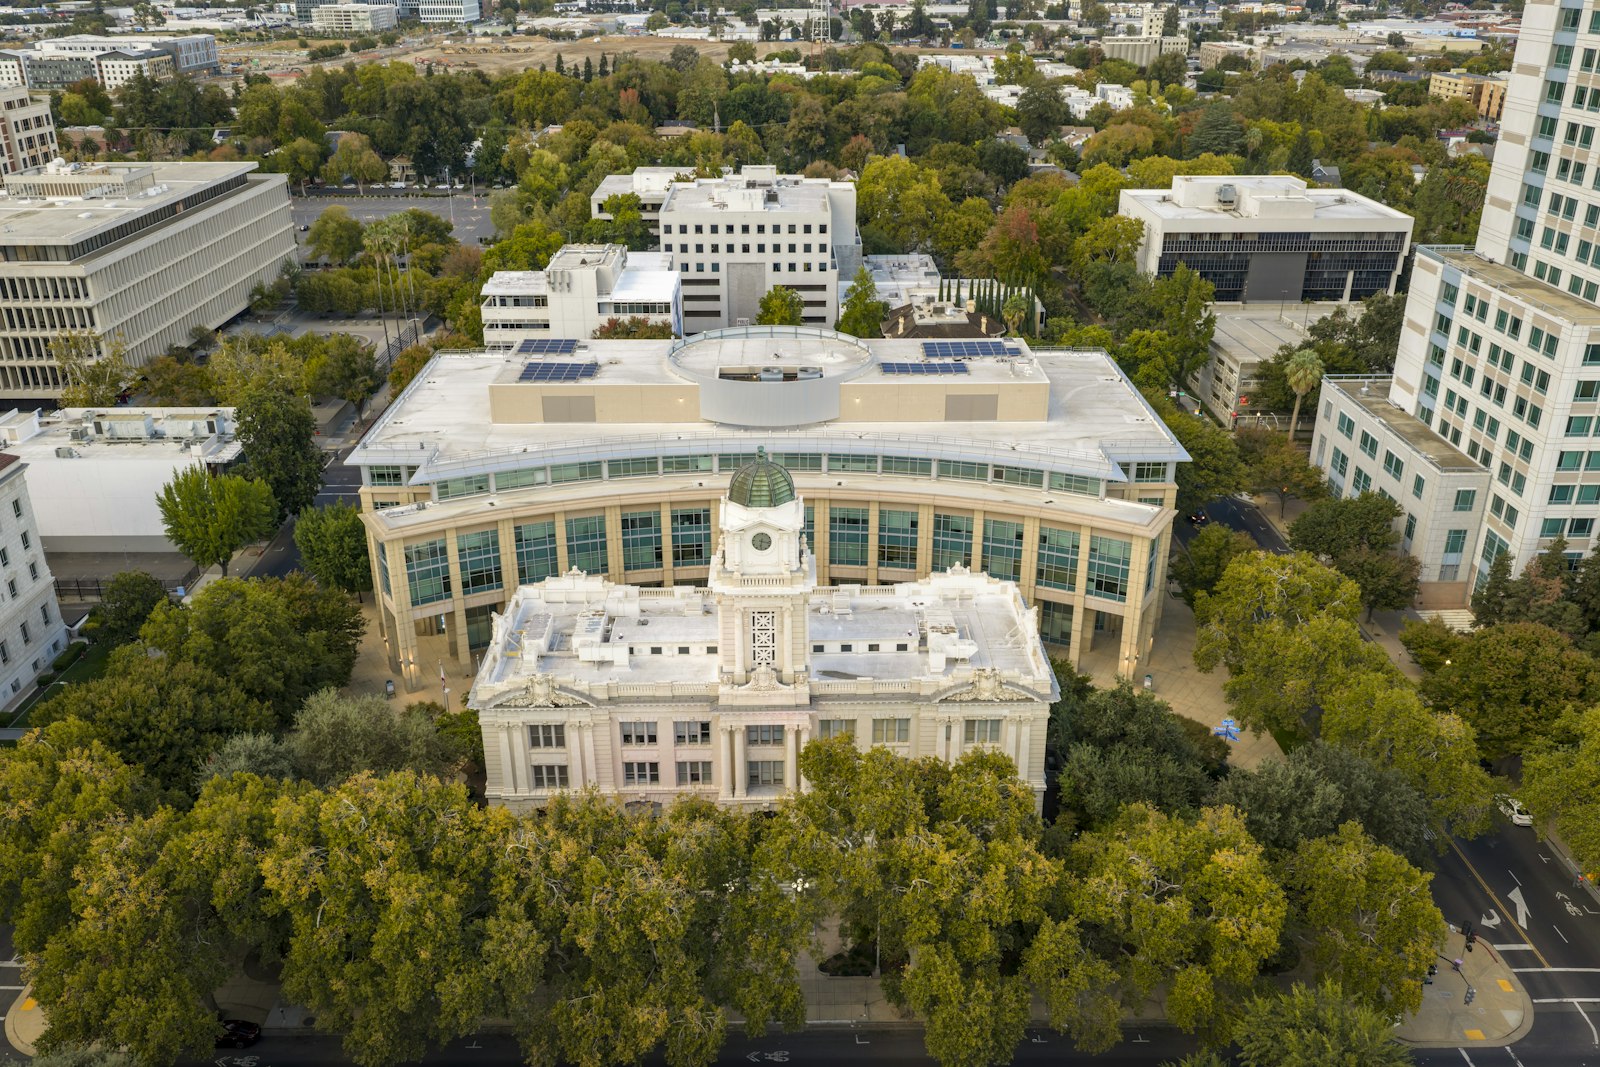
Cloud or on-prem, with data kept where it must stay
- On-prem option
Run on-prem, with on-prem AI on NVIDIA infrastructure, where city data must stay on site.
- Ask in plain language
Staff ask the assistant about a district or building and get usage, peaks and trends in plain language.
- Faults routed
Building faults arrive diagnosed and routed into the city's CMMS, with verified closure for the record.

Running a city estate, before and after Aqueduct
- The annual audit says how much water was lost, not where.
- Public building benchmarking is rebuilt from bills at the deadline.
- Water and building data sit in separate departments and systems.
- Main repairs close when the crew leaves the site.
- Residents hear about savings, but never see the numbers.
 The Aqueduct way
- Loss is localized to a district and a section of main.
- Public buildings are tracked against weather-normalized baselines all year.
- Network and building data sit on one platform, alongside SCADA.
- Repairs close when the district balance confirms the loss stopped.
- Verified results are ready to share with council and residents.
What cities and municipalities teams are up against.
Water, energy, air and operations carry equal weight. Each one runs the same loop: monitor, measure, identify, act, verify.
Water: Non-revenue water, with an address
District by district, supply against billed and metered use. Real losses localized.
Energy: Public buildings, benchmarked and improved
Weather-normalized baselines for every municipal building, ready for benchmarking and performance rules.
Air: Healthy air in public buildings
Schools, libraries and offices held to their targets.
Operations: A small public works team, covering everything
Faults diagnosed and ticketed. Verified closure for the council report.
Problem, solution, impact.
How Aqueduct resolves each problem for cities and municipalities, and what changes when it does.
District by district, supply against billed and metered use. Real losses localized.
A live water balance across meters and sub-meters localizes the loss, routes the fix and confirms it closed at the meter.
Loss found from the balance, not the bill, and every fix verified.
Weather-normalized baselines for every municipal building, ready for benchmarking and performance rules.
Weather-normalized baselines per building and asset show the waste in money; schedules and setpoints adjust where control is enabled.
Savings stated in money and confirmed at the meter, not estimated.
Schools, libraries and offices held to their targets.
Air quality per zone, overlaid with occupancy, with ventilation raised when it matters and verified back in range.
Targets held during occupied hours, with the energy cost counted.
Faults diagnosed and ticketed. Verified closure for the council report.
Faults diagnosed in plain language and routed into your CMMS with the fix; early signs of failure schedule maintenance first.
Fewer reactive call-outs and closures confirmed by the equipment.
One incident, from first signal to verified fix.
An illustrative example of the flywheel on a typical site.
Network flow and pressure from SCADA and AMI, plus building meters.
A baseline per district metered area and per building.
District 6 loss above its model. Night flow up.
Work order routed to the utility crew with the likely section of main.
Night flow back to baseline. Loss reduction verified and reported.
Four connected products on one data layer.
A city should know where its water and energy go, and be able to prove it.
Talk to our teamReplace what should be replaced. Connect the rest.
- Water loss analytics
- Building energy management
- BMS in public buildings
- SCADA
- AMI
- Historians
- CMMS and asset management
- GIS as context
Three equal ways in: keep your BMS, replace it, or build Aqueduct in at design stage.
The questions each seat asks first.
“Does it work across my network, alongside my SCADA and meters?”
“Can I show council a verified saving?”
“Do we meet the benchmarking ordinance?”
Standards and regulations we supply evidence for.
We supply the measured inputs. You run the program and file the report.
Where teams put it to work
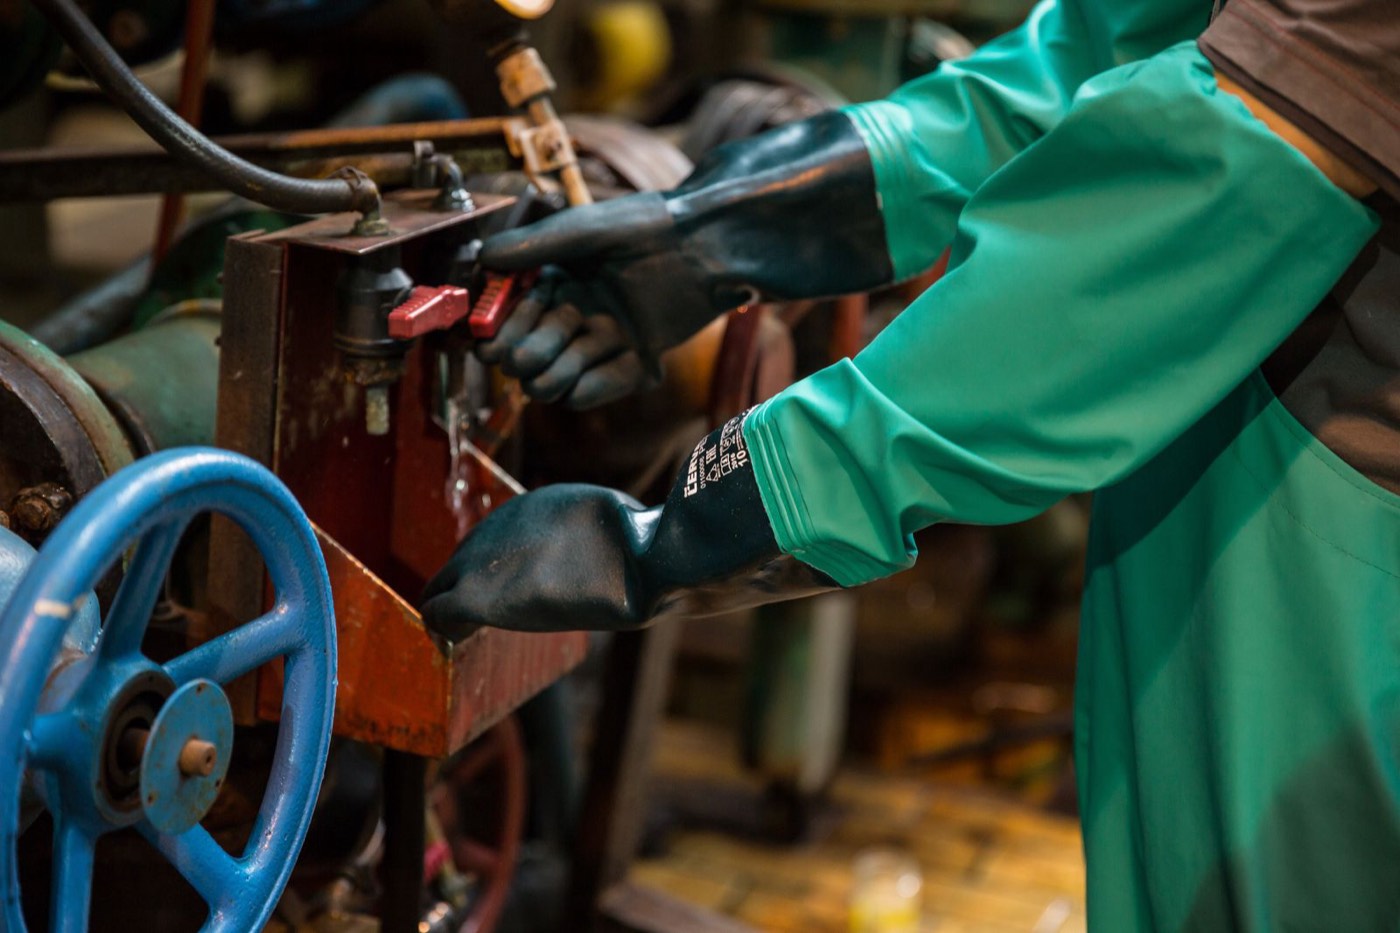
Districts ranked by rising loss
Night flow baselined per district metered area, read alongside SCADA and AMI, so crews go to the district where loss is rising.
Learn more
Every public building, measured
Weather-normalized baselines for every building, faults routed into your CMMS, and savings verified at the meter for the council.
Learn more
Deployment that fits city rules
Cloud or on-prem deployment, with on-prem AI on NVIDIA infrastructure, so data residency answers are settled before the pilot starts.
Learn moreEverything a city pays to run, on one map
A city runs buildings and networks owned by different departments, often with different systems and no shared view. These are the places loss hides.
City hall and offices
Plant running nights and weekends in buildings that close at five.
Building energy, plant run state, zone conditions.
Baselines each building and flags after-hours running.
Libraries and community centers
Small buildings with no engineer on site, where faults run for months.
Building meters and a few key BMS points.
Remote fault detection with tickets to the public works team.
Pools and recreation centers
Pool make-up water, heating and dehumidification with leaks nobody sees.
Make-up water, heating energy, ventilation.
Reconciles pool water and flags loss.
Depots and fleet yards
Vehicle wash water, compressed air leaks and heaters left on.
Water, compressed air and building energy.
Finds wash and air leaks against baseline.
Street and park lighting
Lights burning by day after a photocell or timer fails.
Lighting feeder energy.
Compares lighting load with daylight hours and flags daytime burning.
Parks and irrigation
Irrigation on fixed timers through rain, and broken heads.
Irrigation meters with weather.
Flags watering against rainfall and night flow.
Water distribution
Real losses from mains and service connections, and apparent losses from meters.
District meter flow and pressure, alongside SCADA and AMI.
A balance per district, so loss gets an address.
Pump and lift stations
Pumps running off their best efficiency point, and demand peaks at the wrong hour.
Pump energy, flow and run state.
Baselines each station and flags efficiency loss.
Six departments, one shared record
In most cities, energy, water and buildings belong to different departments, each with its own data. Aqueduct gives them one record without merging their systems.
Public works and facilities
A small team covers dozens of buildings and sites. They need faults found remotely and ranked.
- Faults ranked by cost across all buildings
- Tickets routed into the city's CMMS
- Fixes verified at the meter
- Measured
- building energy, water, key BMS points
- Target
- fewer site visits, faster fixes
- Aqueduct
- diagnosis and verified closure
Water department
Non-revenue water needs a location, not just an annual total. Aqueduct works alongside SCADA and AMI.
- Balance per district metered area
- Night flow baselines
- Repairs verified by the balance
- Measured
- district flow and pressure
- Target
- lower real losses, year on year
- Aqueduct
- localizes loss, control stays with SCADA
Finance and budget
Utility bills across hundreds of accounts are hard to check. Savings claims need to stand up in a budget hearing.
- Bills validated against meters
- Savings stated in money
- Forecasts from weather-normalized use
- Measured
- use and demand per account
- Target
- accurate bills, defensible savings
- Aqueduct
- bill validation and verified savings
Sustainability and climate office
Climate action plans need measured municipal emissions and progress against targets.
- Energy by fuel per building
- Weather-normalized trends
- Exports for climate reporting
- Measured
- energy and water per site
- Target
- the city's climate plan
- Aqueduct
- measured evidence for each reported number
IT and security
City data often must stay inside the city's environment. Aqueduct can run on premises.
- On-premises deployment option
- Role-based access by department
- Integration with existing identity systems
- Measured
- not applicable
- Target
- data stays where policy says
- Aqueduct
- on-prem with AI on NVIDIA infrastructure
Council and residents
Elected officials and residents ask what was spent and what was saved. Measured numbers answer that plainly.
- Verified savings for council reports
- Public dashboards where the city chooses
- Water loss shown by district
- Measured
- verified results
- Target
- transparent reporting
- Aqueduct
- reports built on measured data
What the council asks, and the evidence that answers it
Most questions about municipal utilities come down to a handful. Each has a measured answer.
| The question | The usual answer today | The measured answer |
|---|---|---|
| Which buildings cost us most? | A spreadsheet of annual bills | Use per building, weather-normalized and ranked, updated daily |
| Did the retrofit work? | An engineering estimate from the contractor | Savings verified at the meter against an adjusted baseline |
| How much water do we lose? | An annual audit total | Loss per district, with night flow trends |
| Why was this bill so high? | A call to the utility | Bill checked against meter data before payment |
| Are our buildings healthy? | A complaint, then a site visit | Continuous air records for occupied public buildings |
| Are we on track for our climate plan? | Estimates assembled at year end | Measured energy by fuel and building, all year |
Start with one problem, then extend
Cities usually start with one department's most pressing issue, then extend to the rest of the estate on the same model.
Pick the first problem
Water loss in one district, or the five most expensive buildings. Connect existing meters, SCADA data and BMS where available.
Baselines and first findings
Weather-normalized baselines for each building and night flow for each district. The first losses and after-hours waste are routed to the team.
Fill the gaps
Add meters and sensors where data is missing, installed with Atria. Wireless devices keep installation simple in older buildings.
Extend across departments
Further buildings, pools, depots and districts added. Finance and the climate office start reporting from the same data.
Report with evidence
Verified savings and water loss trends go into council reports and budget requests.
From a council question to a verified answer
Measure
Meters, SCADA and BMS data land in aQ Core, organized by site, building and zone, with the department that owns each.
Baseline
Each building is baselined against weather. Each district is baselined on night flow. History or utility bills give day-one results where meters are new.
Find and route
Loss and waste are flagged with a location and routed into the city's CMMS, with the recommended fix.
Verify
The meter confirms whether the fix worked. The saving is stated in money through rate configuration.
Report
Verified results go to council, finance and residents, in the format the city chooses.
Proven in live sites across sectors.
Anonymized results, verified at the meter.
sites in 21 countries run on Aqueduct.
and 9 clinics in one of India’s top hospital chains.
US airport running water intelligence on Aqueduct.
of commercial real estate under Aqueduct.
Features that matter here
Common questions
No. Aqueduct works alongside your SCADA, AMI and historians. It reads network data; control stays with SCADA.
It supplies the measured volumes per district that a water audit needs, continuously, and shows where real losses are. Your team completes and files the audit.
Yes. Aqueduct can be deployed on-prem, with AI on NVIDIA infrastructure.
Start with a free site survey of one building or one district. Procurement route and funding programs are covered on the government page.
Yes. Access is set by role and department, so the water team, public works and finance each see what they need, while the city can still view the whole estate.
Small buildings often need only a main meter and a few BMS points to find most of the waste. Aqueduct ranks them by cost, so the team visits the ones that matter.
Aqueduct measures savings against an adjusted baseline and keeps the record. What the funder accepts is set by the funder, and the city submits the report.
The city decides. Selected results can be exported or shown on a public dashboard, while operational detail stays internal.
It reads AMI data for the water balance and exports measured use. Billing stays in the city's billing system.
See Aqueduct on your own facility.
Bring a site, a utility bill or a question. We will show you where the loss is.