Airport Carbon Accreditation data, water stewardship and Scope 1 and 2 evidence
Airport Carbon Accreditation asks an airport to map, measure and reduce the emissions it controls, with independent verification. Aqueduct supplies the measured data behind that: metered electricity, fuel and gas for Scope 1 and 2, weather normalized baselines, verified reductions and a water balance for stewardship. Your sustainability team or consultant prepares the carbon footprint and submits it.
Every tonne and every gallon in the airport's report traced back to a meter.
Carbon footprint data from the meter, not the invoice
- By building and system
Electricity, gas and fuel are metered by terminal, plant and support building, not just by account.
- Gaps flagged
Missing intervals and silent meters are flagged with their period, so the footprint states its coverage.
- Factors applied
Grid and fuel emission factors are applied as your team configures them, with source and year shown.

Each reduction separated from weather and traffic
- Weather normalized
Baselines use regression on cooling and heating degree days, so a mild season is not counted as a saving.
- Project by project
Each control change or retrofit is verified against its own baseline, with the before and after kept.
- Audit trail
Command history and change records show what was done, when and with whose approval.

Campus water balance behind every stewardship number
- Withdrawal and use
Supply points and building meters reconcile into one balance for the whole campus.
- Loss and reuse
Unaccounted loss and reuse are tracked by zone, so stewardship goals rest on measured volumes.
- Ready for review
aQ Assurance exports the record for your sustainability team, consultant or verifier.

Airport reporting, before and after Aqueduct
- The carbon footprint is assembled once a year from invoices.
- A project saving cannot be separated from a mild winter.
- Tenant and airport energy sit behind the same meters.
- Water goals are tracked from bills and estimates.
- Verifiers get spreadsheets with no method behind the numbers.
 The Aqueduct way
- Interval data per building and system feeds the footprint.
- Weather normalized baselines separate saving from season.
- Sub-meters separate tenant use from what the airport controls.
- A live campus water balance tracks loss and reuse.
- Verifiers get a measured record with an audit trail.
What each reporting need draws from Aqueduct
Aqueduct supplies measured data. Your team or consultant prepares, verifies and submits. Check the current program rules.
| Reporting need | What it asks for | What Aqueduct supplies |
|---|---|---|
| ACI Airport Carbon Accreditation | A carbon footprint of the emissions the airport controls, a reduction record and independent verification | Metered electricity, gas and fuel by building and system, with baselines and verified reductions |
| GHG Protocol Scope 1 and 2 | Fuel burned on site and purchased electricity, heat and cooling | Interval data per meter, gaps flagged, grid factors applied as your team configures |
| Water stewardship | Withdrawal, use, reuse and loss across the campus | A live water balance with reuse and unaccounted loss by zone |
| ENERGY STAR Portfolio Manager and benchmarking | Annual energy and water use per building | Monthly use per building, ready to enter or export |
| Board and investor reporting | Defensible numbers with a method behind them | Measured baselines, verified results and an audit trail of every change |
Why airport sustainability data is hard to defend
The numbers exist, but they sit in bills, spreadsheets and systems that were never joined.
Footprints built from invoices
Scope 1 and 2 totals are assembled once a year from bills, with no view of which building or system drove them.
Reductions that cannot be shown
Projects are completed, but nobody can separate the saving from a mild winter or a change in traffic.
Tenant and airport use mixed
Concession and tenant use sits behind airport meters, blurring what the airport controls.
Water stewardship on estimates
Water goals are set, but losses on the campus network are found by the bill or not at all.
How Aqueduct supports an accreditation cycle
The Verify step of the flywheel is where reporting data comes from.
Meter what the airport controls
Electricity, gas, fuel and water are metered by building and system, with tenant use separated by sub-meters.
Baseline it
Weather normalized baselines from 6 to 12 months of bills, or from live data, set the expected use for each building.
Act and verify
Projects and control changes are verified against the baseline, so each reduction carries its own evidence.
Keep the record
aQ Assurance keeps interval data, gaps, changes and verified results as one auditable record.
Hand it over
Your sustainability team or consultant uses the record to prepare the footprint and support independent verification.
Programs and frameworks this data supports
Aqueduct supplies the metrics. Your team or consultant files and certifies.
Where teams put it to work

Footprint data ready before the verifier asks
Metered Scope 1 and 2 data, gaps and factors sit in one record, so the footprint is prepared from data rather than invoices.
Learn more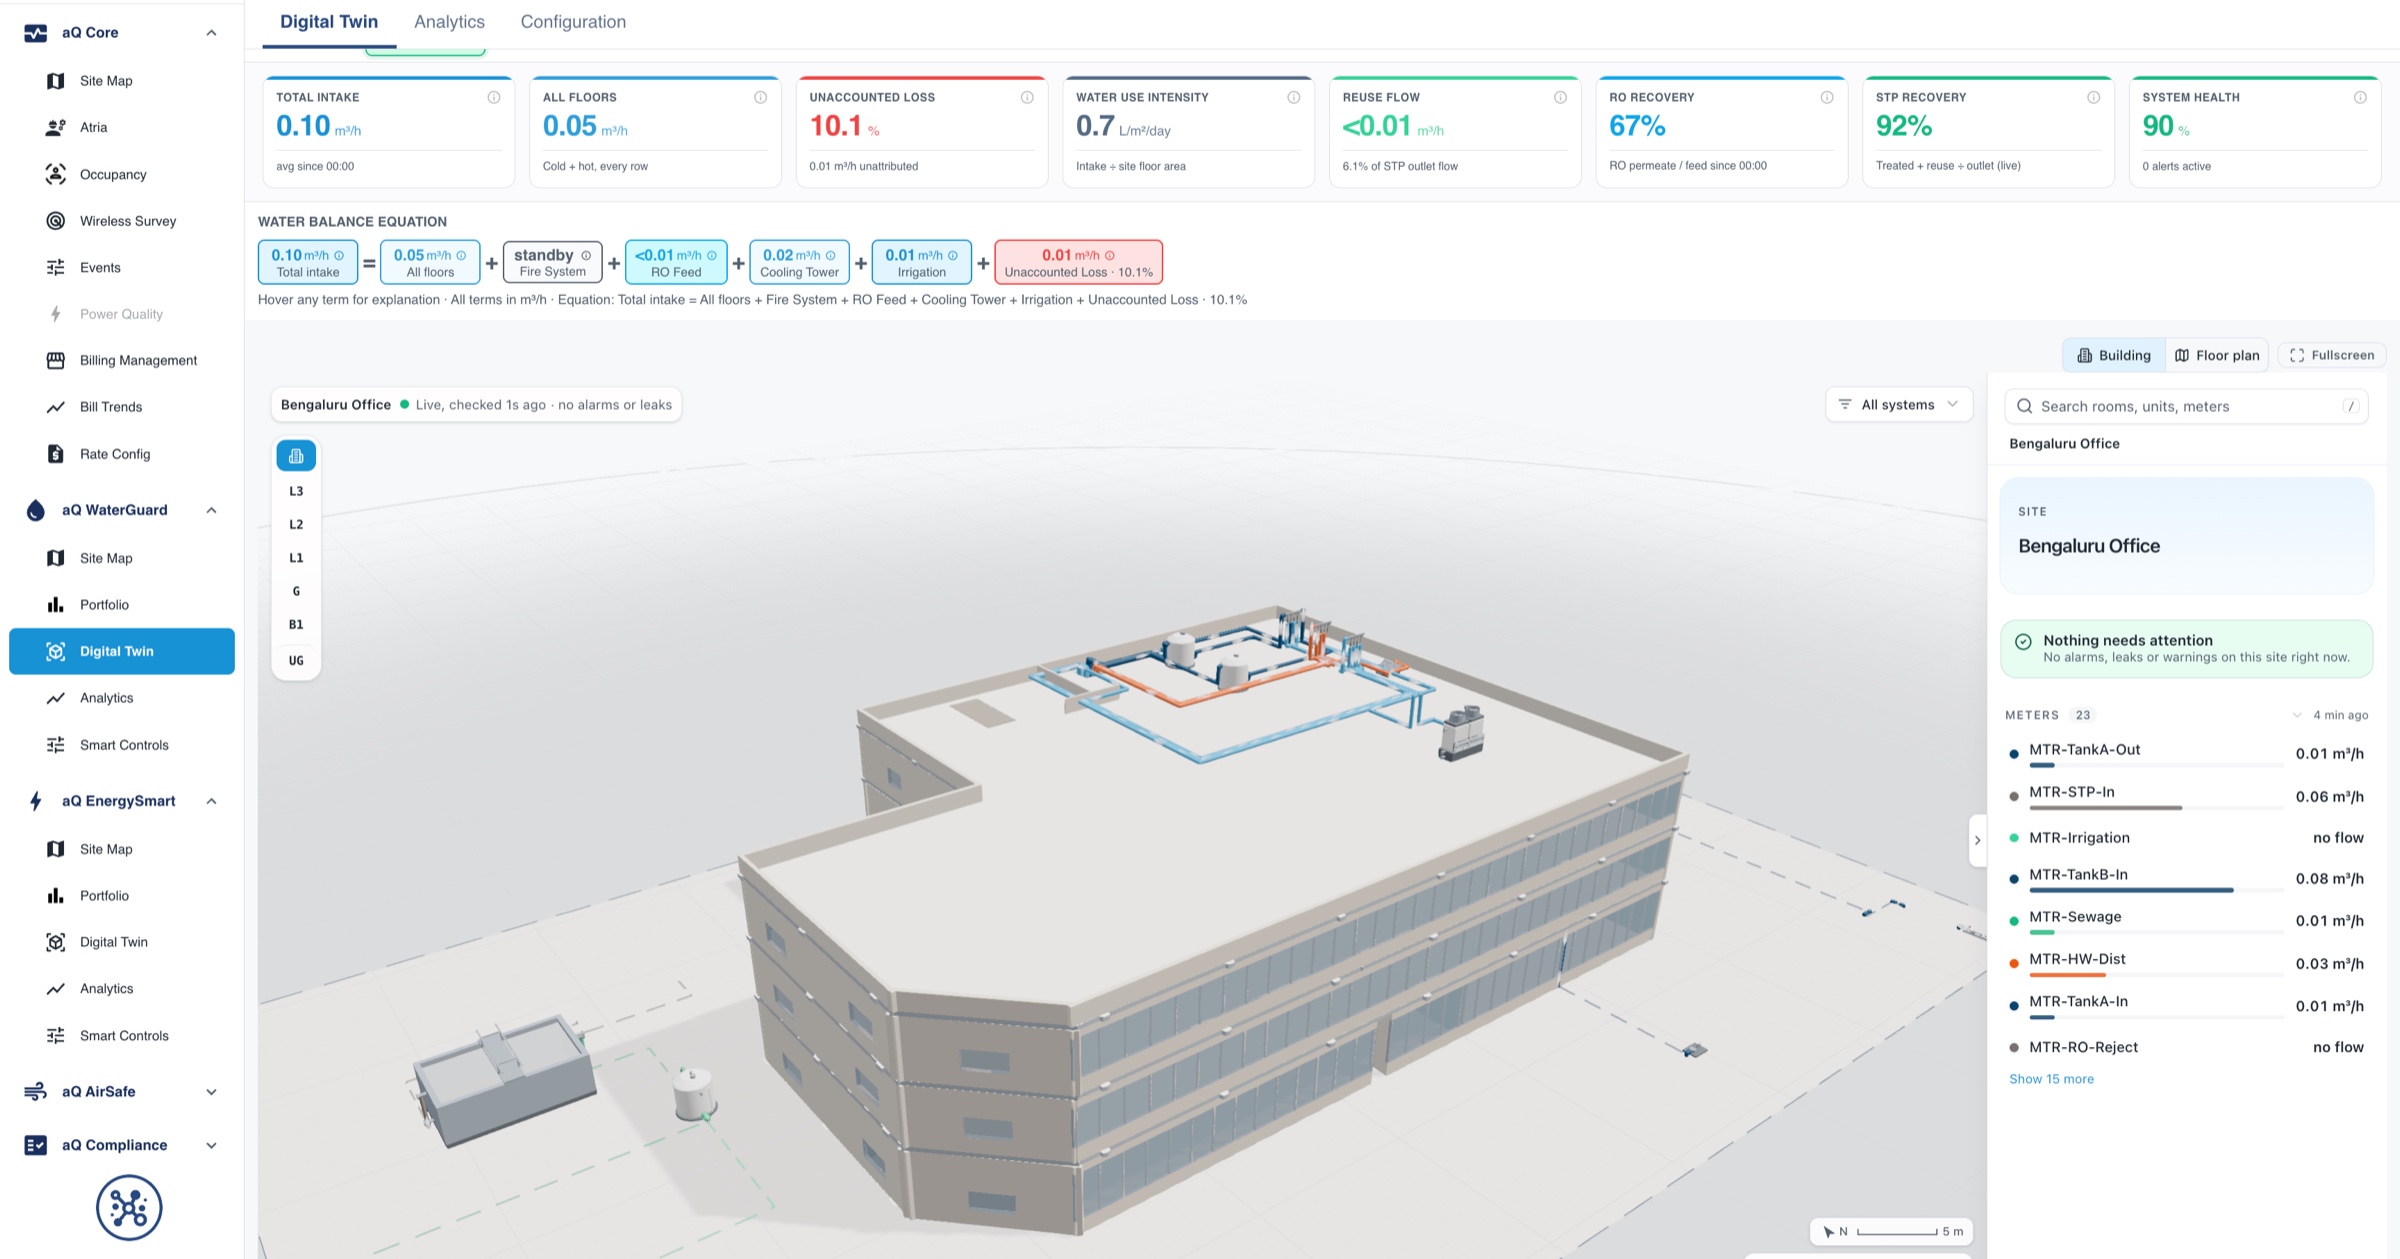
Each project carries its own proof
Control changes and retrofits are verified against weather normalized baselines, so every reduction claimed has a measured before and after.
Learn more
Campus water goals on measured volumes
A live water balance at a top 25 US airport surfaced a major leak at once. The same balance carries stewardship reporting.
Learn moreRelated
Common questions
Airport Carbon Accreditation is a program run by Airports Council International that certifies airports at successive levels for mapping, reducing and managing their carbon emissions, with independent third party verification. Check the current program guidance for the requirements of each level.
At minimum, measured fuel, gas and purchased electricity, heat and cooling for the emissions the airport controls, organized by source and period, with a method an independent verifier can follow. Aqueduct supplies that metered data with baselines and verified reductions.
No. Aqueduct supplies measured evidence and a verified reduction record. Your sustainability team or consultant prepares the carbon footprint, and accreditation is awarded through the program and its independent verifiers.
Tenant and concession sub-meters are reconciled to the main meters. Tenant use can then be reported separately from the energy and water the airport controls directly.
Each building has a baseline built by regression on its historical use and cooling and heating degree days. After a change, actual use is compared with the adjusted baseline, so weather is separated from the effect of the project.
Yes. Aqueduct runs a live water balance across terminals, cargo and support buildings, with reuse and unaccounted loss by zone, so water goals are tracked from measured volumes.
Yes. A top 25 US airport went live on Aqueduct in two weeks across 5,000 meter points on a 24/7 campus, and Aqueduct runs in 275+ sites across 21 countries.
See Aqueduct on your own facility.
Bring a site, a utility bill or a question. We will show you where the loss is.