STP and RO plant monitoring software for measured water reuse
STP and RO plant monitoring software tracks how well on-site treatment plants perform. Aqueduct models the sewage treatment plant and reverse osmosis unit on the live water twin: inlet and treated flow, STP efficiency, BOD out, RO feed, permeate, reject, recovery and TDS, plus reuse flow back into the building, so recycled water is measured rather than assumed.
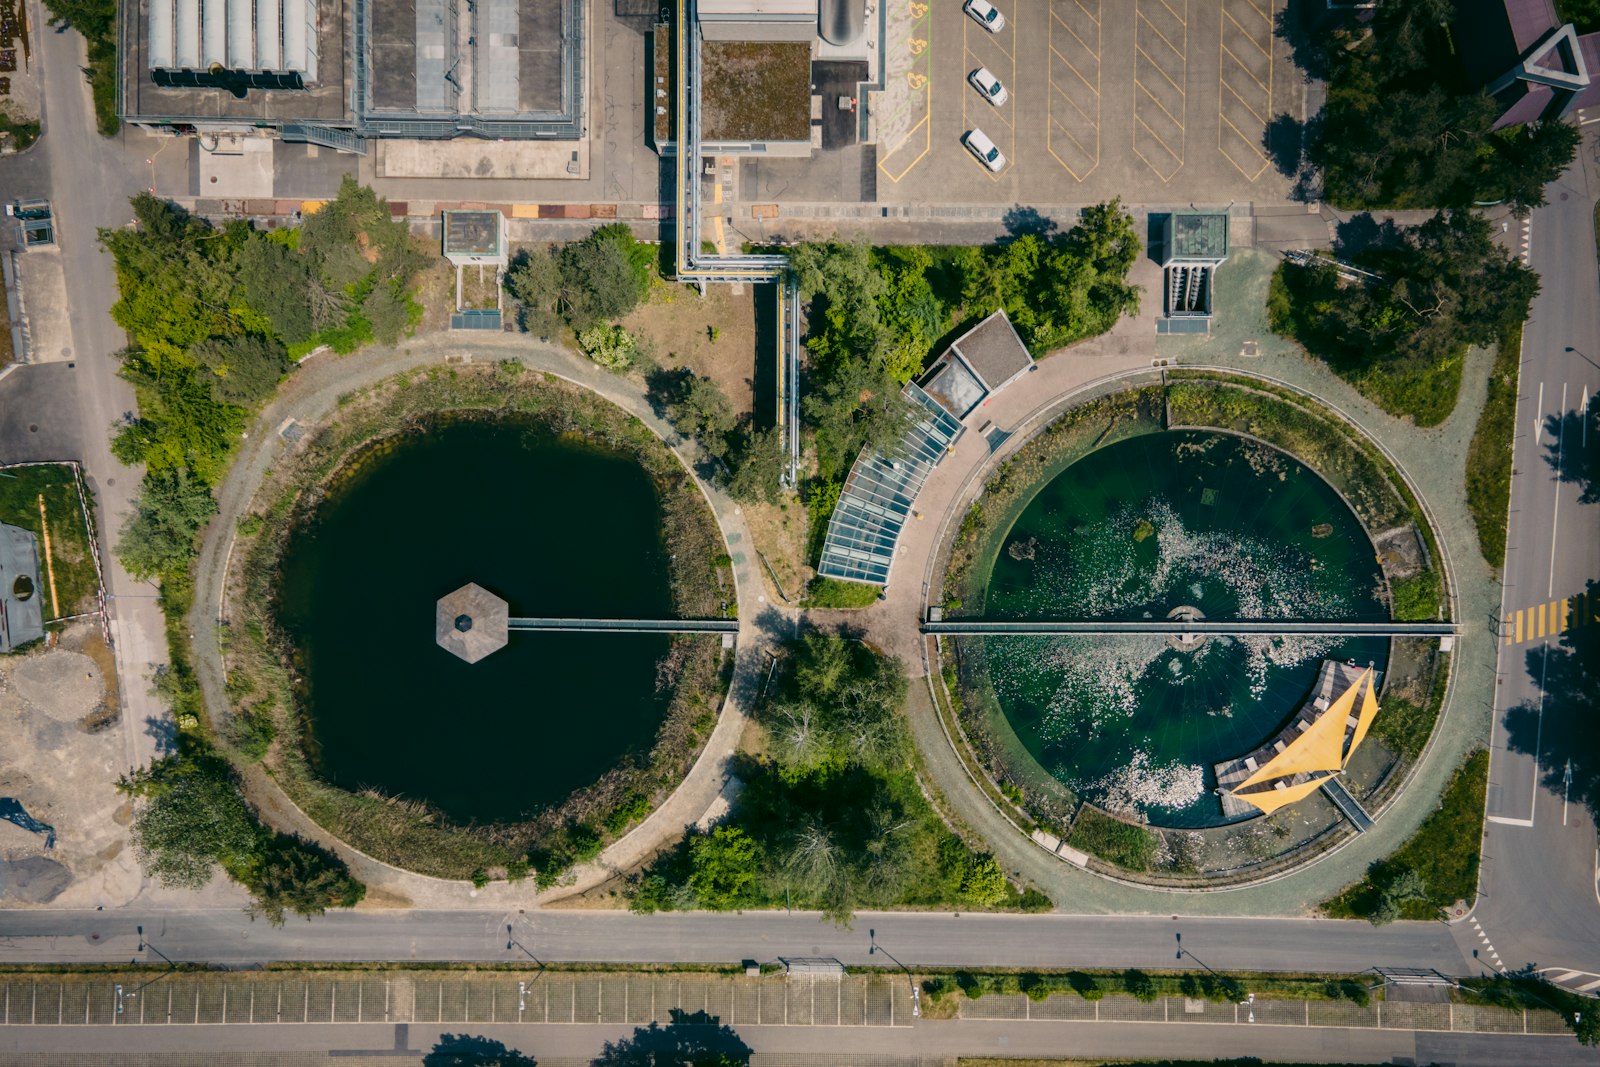
Count recycled water from the meter, not from the design brochure.
STP treatment efficiency measured continuously, not logged by hand
- Inlet and treated flow
Flow into and out of the STP shows throughput and efficiency live.
- Outlet quality
BOD out and other quality readings show whether treated water is fit for reuse.
- Tank levels
Treated water tank levels show how much recycled water is available for reuse in the building.
Recovery, reject and TDS tracked against baseline
- Recovery
Permeate as a share of feed, tracked over time so decline is visible early.
- Reject flow
Rising reject flow shows water lost to the drain as membranes foul.
- TDS in and out
Feed and permeate quality confirm the unit is treating as it should.
Recycled water on the same balance as supply
- Reuse flow
Reclaimed water lines are metered back into the building on the live twin.
- Maintenance on evidence
Membrane cleaning and plant service are scheduled from the trend, routed to your CMMS.
- Verified recovery
After membrane maintenance, RO recovery must return to its baseline before the work item counts as closed.
Water reuse, before and after Aqueduct
- Plant logs are filled in by hand, once a shift.
- RO recovery drifts as membranes foul.
- Reuse is reported from design capacity.
- Quality problems stop reuse without warning.
- Maintenance runs on a fixed calendar.
 The Aqueduct way
- Plant flows and quality report every 60 seconds.
- RO recovery is tracked against its baseline.
- Reuse flow is metered on the live twin.
- Quality drift is flagged before reuse stops.
- Maintenance is scheduled on measured trends.
Why on-site treatment underperforms
Many sites own an STP or RO plant. Few know how well it is running.
Plants run unseen
Treatment plants sit in a basement or yard with manual logs filled in once a shift, if at all.
Recovery drifts
RO recovery falls as membranes foul, and more water goes to reject without anyone noticing.
Reuse is assumed
Sites report recycled water from design capacity rather than measured flow.
Quality issues found late
TDS or BOD drifts out of range before anyone checks, and reuse stops.
How Aqueduct monitors STP and RO
One RO recovery drop, from signal to verified fix.
Flow, level and quality sensors at the STP and RO unit report into the water twin every 60 seconds.
The twin tracks STP inlet, treated flow, efficiency and BOD out, and RO feed, permeate, reject, recovery and TDS in and out.
RO recovery declines over several weeks while reject flow rises. The pattern points to membrane fouling.
A ticket with the trend and a recommended membrane cleaning routes into your CMMS.
After cleaning, recovery returns to its baseline and reuse flow rises. The result becomes the new baseline.
What it needs on site
Existing plant instruments connect if they emit telemetry. New devices are installed through partners.
| Device | What it measures or does | Why it matters |
|---|---|---|
| Flow meters at STP inlet and outlet | Inlet and treated flow | STP efficiency and throughput |
| Flow meters on RO feed, permeate and reject | RO flows | Recovery percentage |
| Quality and TDS sensors | TDS in and out, BOD out | Treated water quality |
| Level sensors on tanks | Tank level percentage | Storage and reuse availability |
| Reuse line meters | Reclaimed water flow | Measured reuse, not design capacity |
Outcome
What changes when treatment plants are on the twin.
Reuse reported from design capacity.
Reuse flow metered on the live twin.
Recycled water measured, with savings verified at the meter against a weather-normalized baseline.
RO recovery drifts unnoticed.
Recovery and reject tracked against baseline.
Membrane maintenance scheduled on evidence.
Plants run at fixed duty regardless of demand.
Plant flows aligned with building demand and tank levels.
Treatment matched to what the site needs.
Who cares about this
The seats that ask for this first.
Where teams put it to work

RO and STP on the hospital twin
Hospitals with on-site treatment track RO recovery and STP efficiency on the same twin as ward water supply.
Learn more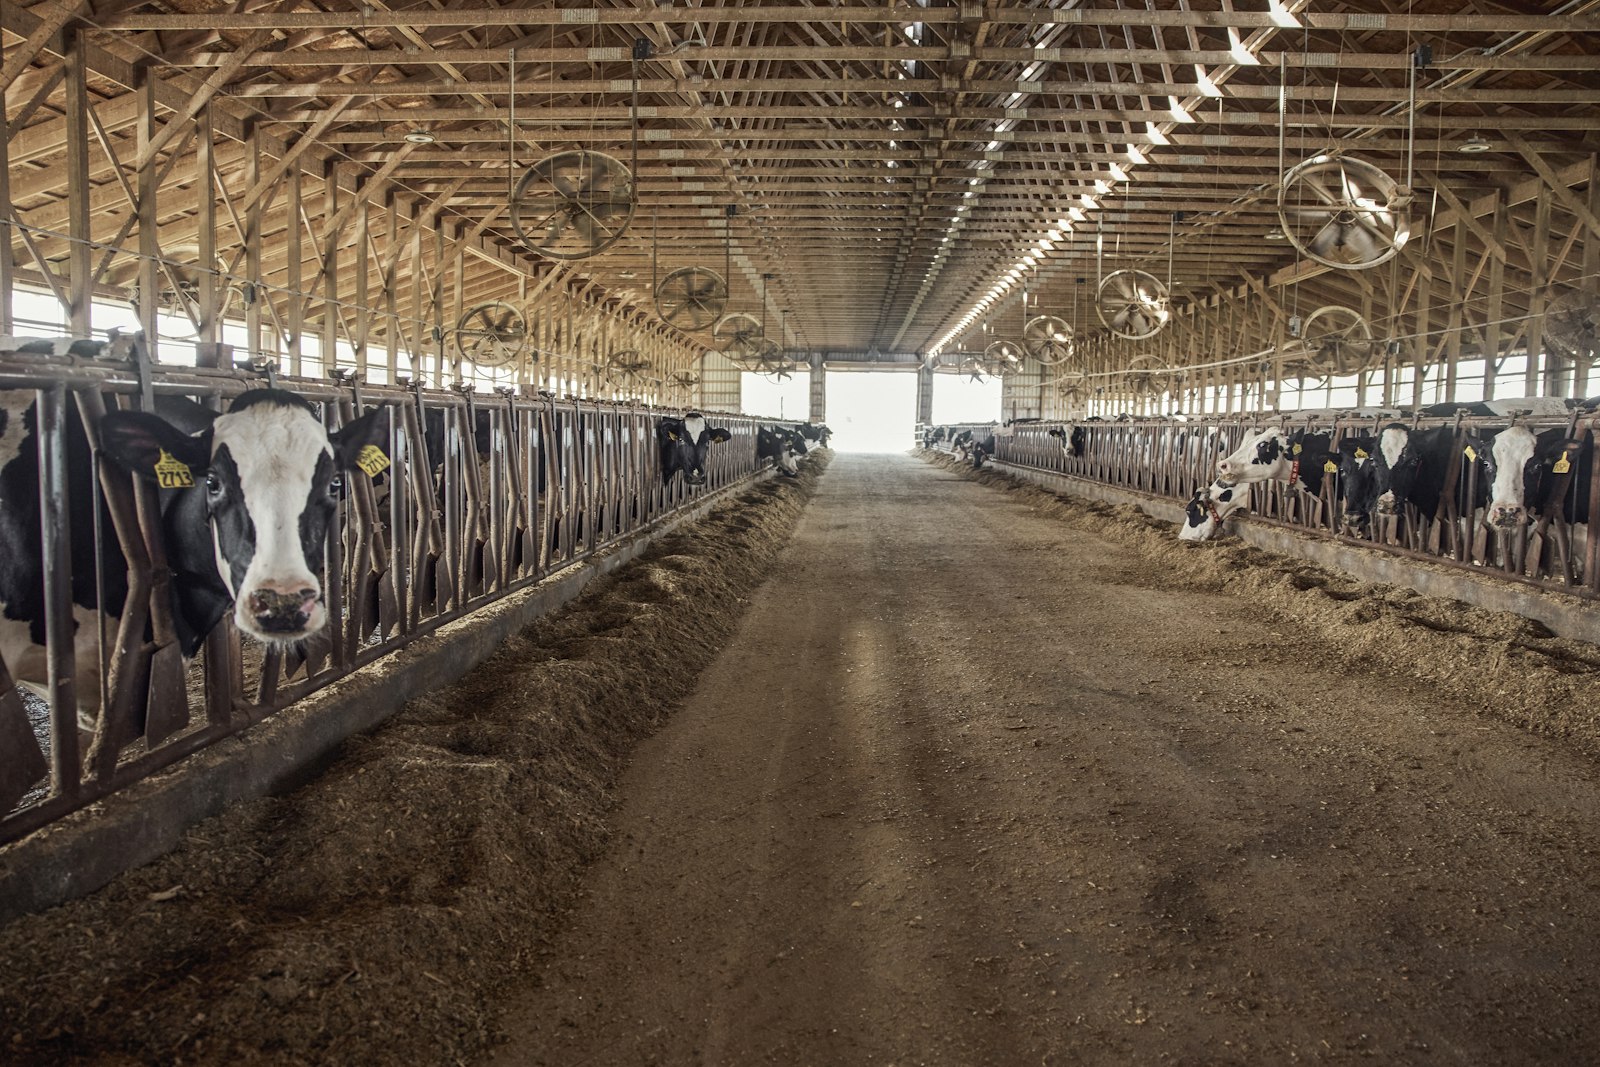
Process water treated and reused
Major dairy operations run on Aqueduct, with process water treatment, recovery and reuse measured at the plant rather than estimated.
Learn more
Treatment matched to production
Plants align treatment and reuse with production schedules, with plant performance flagged well before it limits production output on the line.
Learn moreWhere on-site treatment loses water and credibility
Plants rarely fail outright. They drift, and the reuse figure in the report stays at design capacity.
RO reject
Reject rises as membranes foul and more feed goes to drain
Feed, permeate and reject flow, TDS in and out
Recovery tracked against its baseline
STP throughput
Plant runs below capacity while fresh water fills the gap
Inlet and treated flow
Efficiency and throughput on the twin
STP outlet quality
BOD drifts high and reuse is stopped without warning
BOD out, quality sensors
Flags drift before reuse stops
Treated water storage
Tanks overflow to drain while fresh water tops up elsewhere
Tank level
Level against reuse demand
Reuse distribution
Reuse assumed for flushing and irrigation but not metered
Reuse line meters by end use
Reuse on the same balance as supply
Cooling tower blowdown
Blowdown sent to drain at conservative rates
Blowdown flow and conductivity
Cycles of concentration as a measured value
Condensate
Hot treated condensate not returned
Condensate return flow
Return measured, not assumed
Discharge limits make quality evidence matter
maximum BOD for effluent discharged to inland surface water under India's general standards
Source: Environment (Protection) Rules 1986, Schedule VI general standards for dischargemaximum oil and grease for discharge to inland surface water under the same standards
Source: Environment (Protection) Rules 1986, Schedule VI general standards for dischargeDubai's target cut in electricity and water demand by 2030, against business as usual
Source: MEED: Dubai updates energy savings targetWhat to meter on each stream, and the claim it supports
Each reuse claim needs specific measurements behind it.
| Stream | Points to meter | The claim it supports |
|---|---|---|
| RO systems | Feed, permeate, reject, TDS in and out | Recovery as a measured percentage |
| STP | Inlet, treated flow, BOD out, tank level | Treatment efficiency and reuse availability |
| Reuse lines | Flow by end use: flushing, irrigation, cooling | Reuse as a measured share of demand |
| Cooling towers | Make-up, blowdown, conductivity | Cycles of concentration achieved |
| Boiler house | Condensate return flow | Condensate recovered rather than assumed |
| Discharge | Final outlet flow and quality | Volume and quality leaving the site |
From a manual log sheet to a live treatment twin
An illustrative sequence for a site with an STP and one or more RO units.
Survey the plant
Existing flow meters and quality instruments are listed. Those that emit telemetry connect; gaps on reject, reuse and tank level are planned.
Meter the streams
RO feed, permeate and reject, STP inlet and outlet, tank levels and reuse lines are metered through partners.
Baseline recovery and efficiency
RO recovery and STP efficiency baselines are learned so drift shows against the plant's own normal.
Maintain on evidence
Membrane cleaning and plant service are scheduled from trends and closed only when recovery returns to baseline.
Sources2 references cited on this page
sites in 21 countries run on Aqueduct.
and 9 clinics in one of India’s top hospital chains.
US airport running water intelligence on Aqueduct.
of commercial real estate under Aqueduct.
FMCG manufacturing campus.
operations run on Aqueduct.



Related
Common questions
STP monitoring tracks a sewage treatment plant's inlet flow, treated flow, efficiency and outlet quality such as BOD. Aqueduct puts these on the live water twin alongside the rest of the site's water system.
RO recovery is permeate flow as a share of feed flow. Aqueduct measures feed, permeate and reject continuously, so recovery and its trend are visible, along with TDS in and out.
Common causes include membrane fouling, scaling and changes in feed water quality. Aqueduct tracks recovery and reject flow against baseline so the decline is flagged and maintenance can be scheduled.
Yes. Reuse flow and reclaimed water lines are metered on the water twin, so reuse is reported from measurement rather than design capacity.
No. Aqueduct monitors plant performance, flags issues and routes work into your CMMS. Plant operation stays with your team or operator, and any control runs only where enabled with owner approval.
Sites with on-site treatment, such as hospitals, campuses, manufacturing plants, dairy and food processors and large commercial buildings, especially where water is scarce or reuse is a commitment.
It measures intake, reuse, reject and discharge streams continuously, which is the evidence a ZLD claim rests on. Your team and the regulator assess compliance; Aqueduct supplies the record.
Many plants have flow meters and some online quality instruments. Those connect if they emit telemetry, and gaps such as reject or reuse line meters are filled through partners.
It looks at recovery, reject flow and TDS together. Recovery falling with stable feed quality points to fouling, while a TDS change in the feed points upstream.
Yes. With reuse lines metered, reuse sits on the same water balance as supply, so it can be expressed as a measured share of site demand.
Yes, as measured reuse flow by end use and as a share of site demand. Your team or consultant prepares the report; Aqueduct supplies the metered record.
See Aqueduct on your own facility.
Bring a site, a utility bill or a question. We will show you where the loss is.