GRESB asset-level energy and water data, with the coverage investors look for
GRESB is the global ESG benchmark for real assets, used by investors to compare real estate and infrastructure portfolios each year. Its performance component asks for asset-level energy, GHG, water and waste data, data coverage and like-for-like change. Aqueduct supplies metered energy and water per asset, coverage visibility and verified savings. Your sustainability team or consultant prepares the submission.

Asset-level data your investors can trust, with coverage you can see.
Energy and water metered per asset, month by month
- Every fuel
Electricity and gas per asset roll up from main meters and sub-meters by month.
- Water balanced
Metered water per asset is reconciled in a live balance before it is reported.
- Tenant shares
Shared meters show landlord totals and each tenant's share, while tenants see only theirs.

See which assets are measured before the submission window
- Coverage map
Metered and unmetered assets and areas are listed, so gaps are planned, not discovered.
- Device health
Connection rate per device shows where data stopped flowing and needs attention.
- Complete years
Missing months are found in the month, so the reporting year stays complete.

Like-for-like improvement backed by verified savings
- Consistent assets
The same meters per asset across reporting years make like-for-like comparisons simple to build and easy to defend.
- Savings verified
Each saving is confirmed at the meter against a weather-normalized baseline.
- Clean exports
Totals by asset, fuel and period export for your team or consultant.

GRESB data, before and after Aqueduct
- Asset data is collected from property managers once a year.
- Coverage gaps are found during the submission window.
- Tenant consumption is estimated from floor area.
- Like-for-like change mixes weather, occupancy and real savings.
- Investors question numbers nobody can trace to a meter.
 The Aqueduct way
- Asset data is metered and collected every month.
- Coverage gaps are visible and fixed during the year.
- Shared meters show each tenant's measured share.
- Verified savings explain every like-for-like improvement you report.
- Every number traces back to a meter and a period.
What GRESB is and who it applies to
GRESB is an investor-driven organization that runs annual ESG assessments for real estate and infrastructure. Property companies, real estate funds, developers and infrastructure operators submit data once a year, and investors use the results to compare portfolios. Participation is voluntary, but many institutional investors expect it.
The Real Estate Assessment has a management component, covering policies and processes, and a performance component, covering asset-level data on energy, greenhouse gas emissions, water and waste. Data coverage, like-for-like change and the quality of the data all affect the result, along with green building certifications held by assets.
GRESB rewards measured, complete data. Estimated or partial coverage is the most common place portfolios lose ground.
GRESB requirement areas and the evidence Aqueduct supplies
Asset-level measured data for the performance component. Policies and the submission stay with you.
| Requirement area | Evidence Aqueduct supplies |
|---|---|
| Energy consumption | Metered electricity and gas per asset, by month, from main meters and sub-meters |
| Data coverage | Which assets and areas are metered, and device health showing where data is missing |
| Like-for-like change | Consumption for the same assets across years, with weather normalization for context |
| GHG emissions inputs | Consumption by fuel for Scope 1 and 2 calculations in your carbon accounting tool |
| Water consumption | Metered water per asset, reconciled in a live water balance |
| Landlord and tenant split | Shared and dedicated meters, with landlord and tenant shares shown separately |
| Efficiency measures | Savings from fixes and controls verified at the meter |
How Aqueduct supplies GRESB data
Collect all year, submit once.
Meter each asset
Energy and water meters connect over LoRaWAN, Modbus, M-Bus or pulse outputs. Existing meters connect where they emit telemetry.
Close the coverage gaps
Aqueduct shows which assets and tenant areas are metered and where devices stopped reporting, so coverage improves during the year.
Find and verify savings
Waste is found and routed to your CMMS, and savings are verified at the meter, which shows in like-for-like change.
Export by asset
Annual and monthly totals export by asset and fuel for your team or consultant to prepare the submission.

What stays with your sustainability team
Aqueduct supplies performance data, not the assessment.
Management component
Policies, governance and processes are documented by your organization.
Submission and validation
Your team or consultant prepares and submits the assessment, which GRESB validates.
Waste and other data
Waste and some tenant data come from sources outside Aqueduct's scope.
Related frameworks
Often reported alongside GRESB.
Where teams put it to work
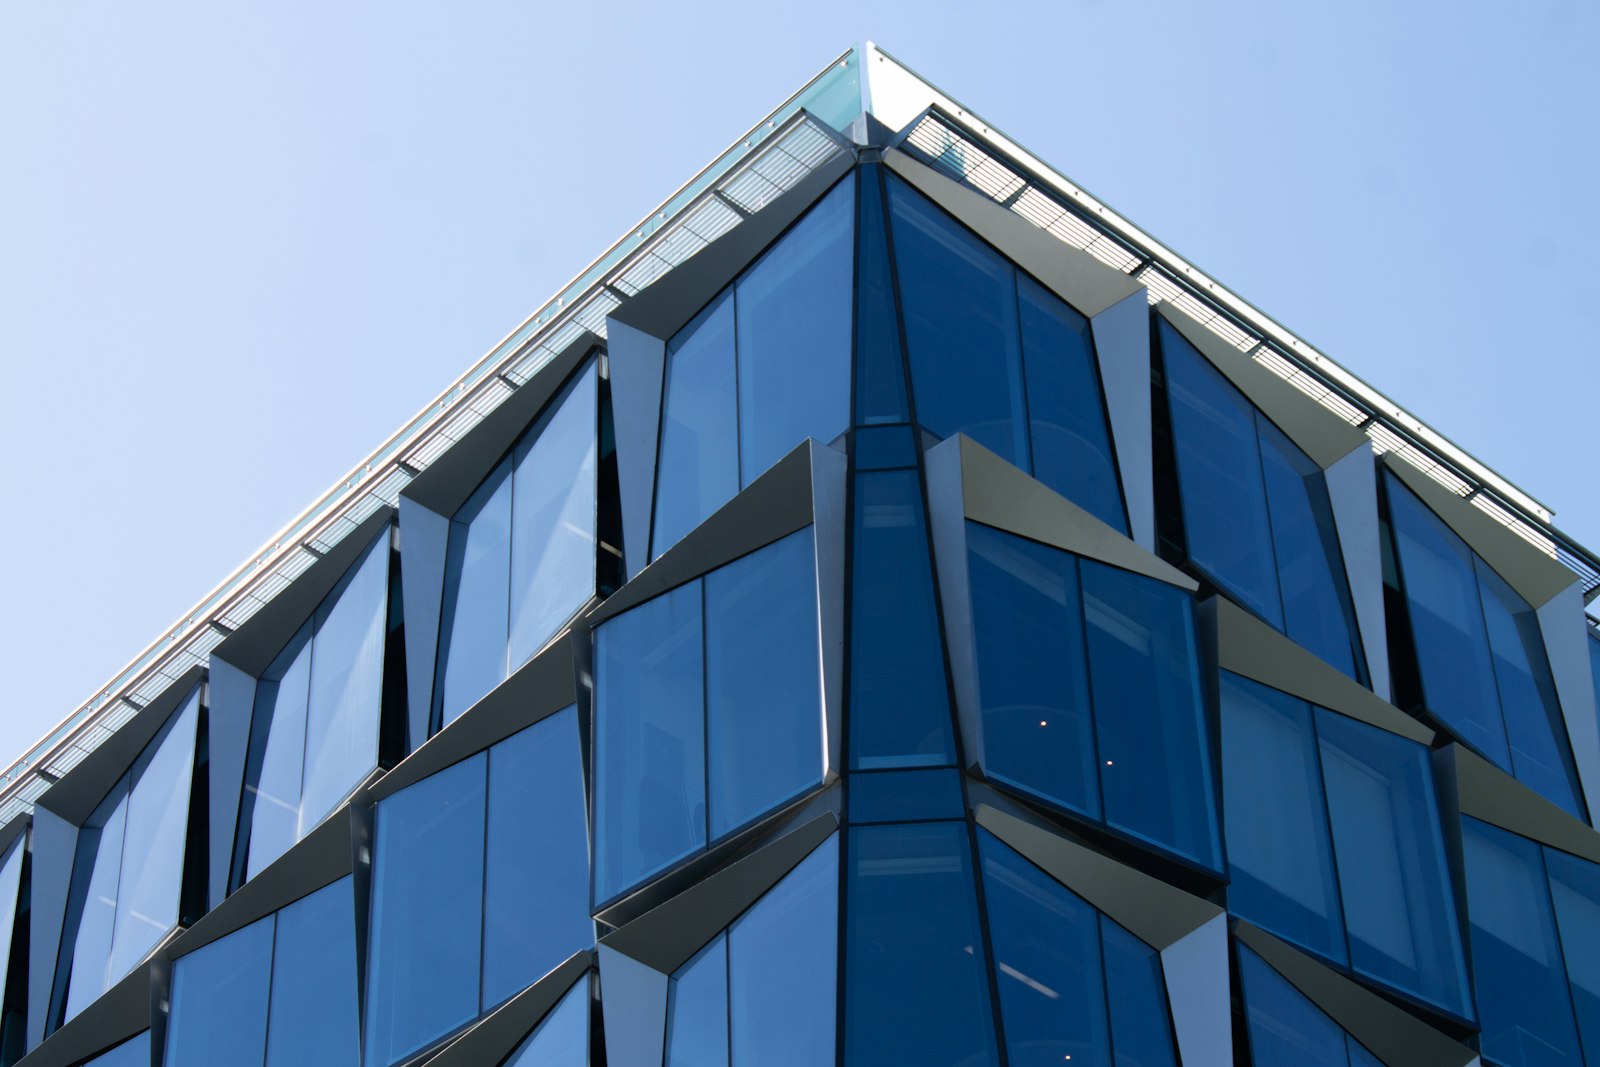
Large portfolios with investor reporting
A commercial real estate client with a 20M+ sq ft portfolio reports to investors every year. Measured asset data keeps the submission consistent.
Learn more
Landlord and tenant data separated
Mixed use assets with shared meters need landlord and tenant consumption split fairly. Aqueduct shows each share from the same meter.
Learn more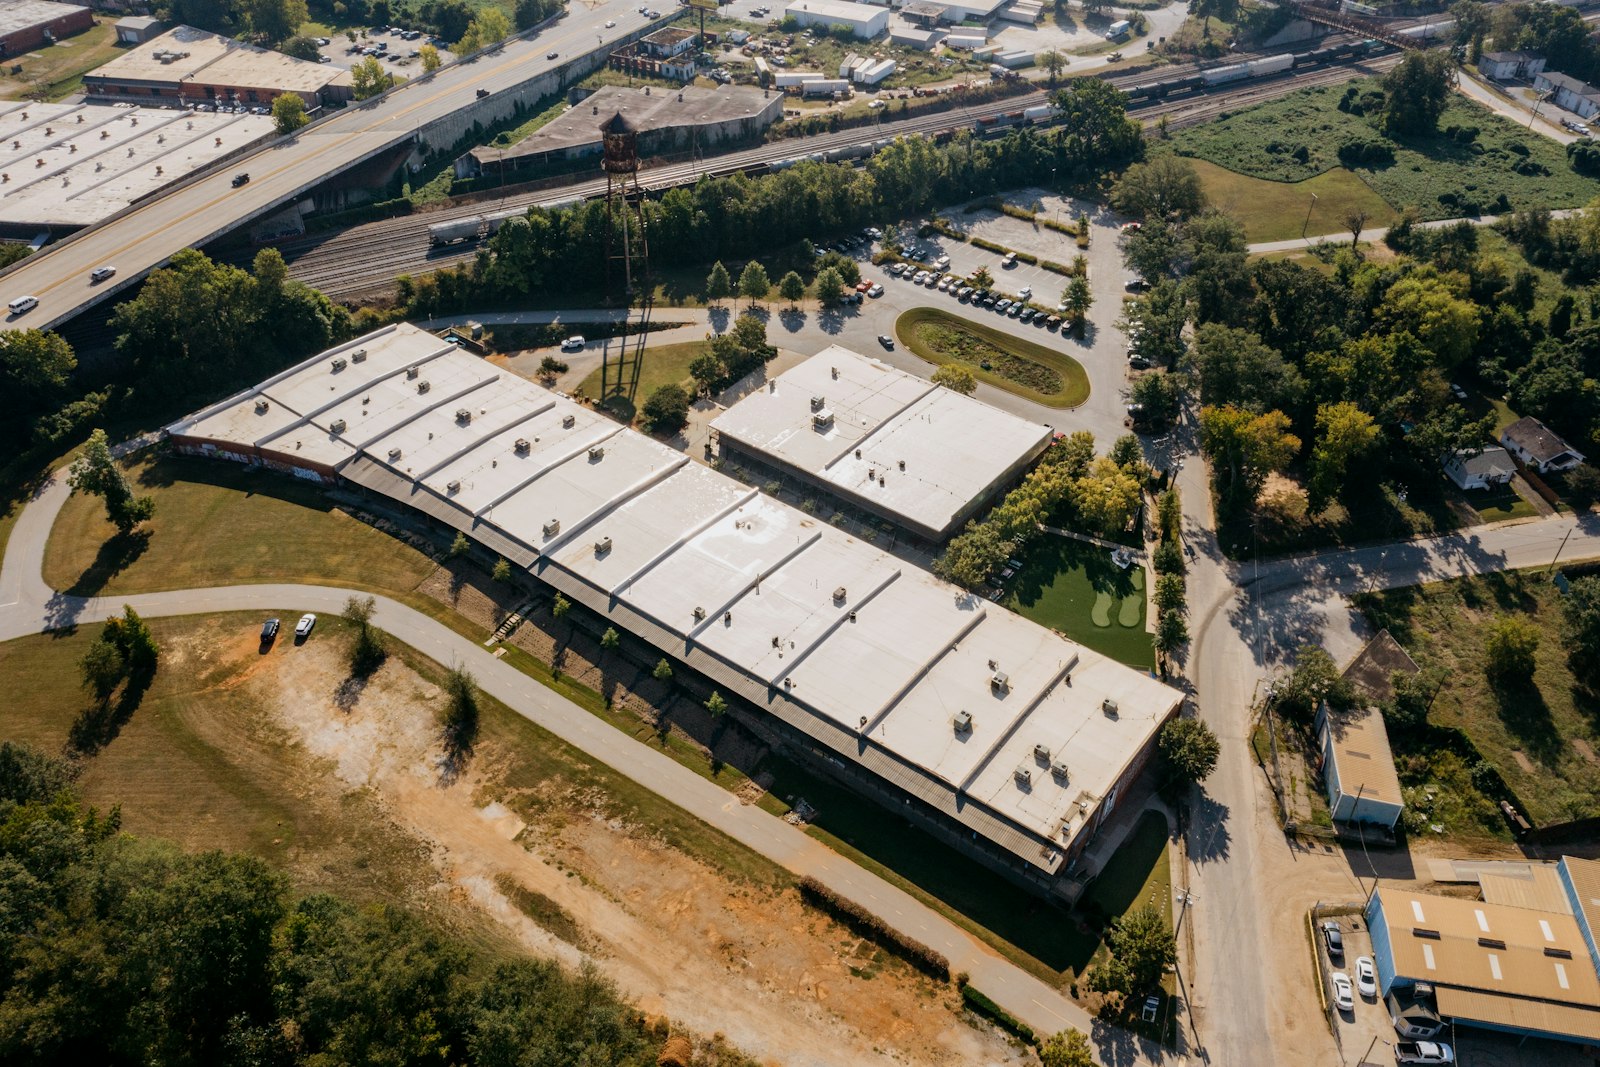
Warehouses with meters at last
Logistics assets often have one meter and no sub-metering. Aqueduct adds coverage through LoRaWAN without disturbing tenant operations.
Learn moreThe GRESB performance indicators that reward measured data
The GRESB Real Estate Assessment has a Management component and a Performance component. The Performance component is where asset-level data coverage and like-for-like change drive the score.
Energy consumption and coverage
GRESB asks for energy by asset, split by landlord and tenant control where relevant, with data coverage reported by floor area and time.
- Energy by fuel per asset
- Landlord and tenant split
- Coverage by area and months
- Data needed
- asset-level energy with coverage
- Source
- utility and sub-meters
- Aqueduct
- coverage per asset and per meter
Greenhouse gas emissions
Emissions are reported by scope at asset level, calculated from energy data. Consistency with energy coverage matters.
- Scope 1 and 2 by asset
- Factors recorded
- Consistent with energy totals
- Data needed
- energy with factors
- Source
- the energy dataset
- Aqueduct
- emissions inputs with factor source
Water consumption
Water by asset, with coverage, is scored in the same way as energy. Water data is often the weakest area in a portfolio.
- Water by asset and source
- Landlord and tenant split where relevant
- Coverage by area and months
- Data needed
- asset-level water
- Source
- main and sub-meters
- Aqueduct
- water totals with leak flags
Like-for-like change
Like-for-like compares assets held with consistent data over two years, removing acquisitions, sales and major works. It shows real performance change.
- Two consistent years per asset
- Exclusions recorded
- Weather context for explanation
- Data needed
- two years of consistent data
- Source
- the measured dataset
- Aqueduct
- year-on-year per asset
Validation and data quality
GRESB validates submissions and checks outliers. Third-party review or assurance of data can also be reported.
- Outliers explained
- Source evidence available
- Assurance status recorded
- Data needed
- traceable figures
- Source
- meter registers and readings
- Aqueduct
- meter-to-total exports
Raising data coverage before the next assessment
For fund managers and REITs preparing a GRESB submission across many assets.
Measure current coverage
Load bills and existing meter data per asset, and see coverage by area and months for energy and water.
Close the biggest gaps
Connect landlord meters and add wireless sub-meters for tenant spaces and water where coverage is lowest.
Build like-for-like years
Keep data consistent across the year, with acquisitions, disposals and works recorded as they happen.
Export by asset
Export energy, emissions inputs and water per asset with coverage and trails for your sustainability team to enter.
GRESB indicators mapped to meters and sensors
Indicator names change between years. Confirm against the current assessment reference guide.
| Indicator area | What to measure | Meters and sensors | Aqueduct output |
|---|---|---|---|
| Energy, landlord controlled | Common area and central plant energy | Landlord utility and sub-meters | Asset totals and coverage |
| Energy, tenant controlled | Tenant space energy | Tenant sub-meters, wireless CT meters | Tenant totals and coverage |
| GHG emissions | Energy by fuel with factors | Same meters | Scope 1 and 2 inputs |
| Water | Water by asset | Main and sub-meters | Asset totals and coverage |
| Like-for-like | Consistent two-year data | Same meters | Year-on-year per asset |
| Data coverage | Area and time covered | Device health on every meter | Coverage reports |
| Building certifications | Performance data for ratings | Energy, water and air sensors | Exports for LEED, BREEAM, NABERS and ENERGY STAR |
Where GRESB data coverage is usually lost
Tenant spaces
Landlords often have no visibility of tenant energy. Wireless CT meters on tenant boards or data sharing agreements close the gap without rewiring.
Water in multi-let assets
Water is billed at one meter and rarely split. Sub-meters on cores, cooling towers and irrigation show where it goes and find leaks.
Assets changing hands
Acquisitions arrive with missing history. Bills uploaded on day one give a starting baseline while meters are connected.
Sources1 references cited on this page
sites in 21 countries run on Aqueduct.
and 9 clinics in one of India’s top hospital chains.
US airport running water intelligence on Aqueduct.
of commercial real estate under Aqueduct.
FMCG manufacturing campus.
operations run on Aqueduct.


Related
Common questions
GRESB is the global ESG benchmark for real assets, assessing real estate and infrastructure portfolios every year for investors. Aqueduct supplies the asset-level energy and water data that its performance component asks for.
The performance component needs asset-level energy, greenhouse gas, water and waste data, along with data coverage and like-for-like change. Aqueduct meters energy and water per asset and shows where coverage is missing.
Coverage improves when more assets and floor area are metered and data is complete for the year. Aqueduct shows which assets are metered and flags devices that stop reporting, so gaps are fixed during the year, not at submission.
Like-for-like compares consumption for the same assets across two years, removing the effect of acquisitions and sales. Aqueduct supplies consistent metered data per asset and verifies the savings that drive like-for-like improvement.
No. Your team or consultant prepares and submits the assessment, including the management component. Aqueduct supplies the measured performance data and exports by asset.
Yes. Aqueduct handles shared and dedicated meters: a landlord sees total consumption and each tenant's share, while a tenant sees only their own share.
Aqueduct supplies consumption by fuel as the input to Scope 1 and 2 calculations. Your carbon accounting tool or consultant applies emissions factors and calculates the totals.
At the start of the reporting year, not the submission window. Data collected live through the year needs only review at submission, while data gathered late usually has gaps.
Coverage is the share of floor area and time for which you have actual consumption data. Higher coverage usually improves the performance score.
GRESB rules on estimates vary by indicator and year. Measured data reduces reliance on estimates and makes validation easier.
Yes. The same measured data supports LEED, BREEAM, NABERS and ENERGY STAR, which GRESB recognizes in its building certifications indicators.
See Aqueduct on your own facility.
Bring a site, a utility bill or a question. We will show you where the loss is.