FMCG plant utility monitoring, measured per business unit across the campus
FMCG plant utility monitoring measures water, electricity, steam and compressed air for each business unit on a campus, from milling and beverages to edible oils and personal care. Aqueduct puts every unit on one live view, ranks them by use per tonne or per litre of output, finds leaks, idle load and drift, routes the fix to your CMMS and verifies the result at the meter.
Every business unit measured on its own terms, and the whole campus seen as one system.
Every business unit ranked by what it really draws
- Total and intensity
Units are ranked on total use and on use per tonne, litre or batch, side by side.
- Missing data flagged
An uninstrumented unit or a silent meter is obvious on day one, not discovered at month end.
- Waste events scanned
Leaks, overflows and idle loads are scanned across every unit without anyone logging in.

Central steam, air and water allocated on measured use
- Boundary metering
Steam, compressed air and treated water are metered where they enter each business unit.
- Fair allocation
The utilities block cost is split on what each unit drew, not a fixed percentage set years ago.
- Losses between meters
Distribution losses between the utilities block and the units appear as their own line.

Findings routed, loads scheduled and results verified at the meter
- Routed to your CMMS
Each finding goes to the unit that owns it, with the evidence and a recommended fix.
- Smart Controls
Pumps, VFDs and air handlers run on schedules and rules where control is enabled, with owner approval.
- Verified saving
The result is compared against the weather and production normalized baseline before it is counted.
Running an FMCG campus, before and after Aqueduct
- Each unit sees one bill and no breakdown behind it.
- A small intense unit hides behind a large efficient one.
- Shared steam and air are split on an old fixed percentage.
- Losses between the incomer and units sit in nobody's budget.
- Disclosures are compiled from bills and logbooks each year.
 The Aqueduct way
- Every unit has live water, power and steam by line.
- Units are ranked on use per tonne, litre or batch.
- Shared utilities are allocated on metered use at each boundary.
- Distribution losses show as their own line on the twin.
- Line level, timestamped records are ready before anyone asks.
Where utilities go on a multi-unit FMCG campus
Each unit has a different utility profile. Aqueduct measures each against its own baseline and its own unit of output.
| Business unit | Heaviest utilities | What Aqueduct measures first |
|---|---|---|
| Grain milling | Electricity for mills, conveying and dust extraction | Feeder kW per tonne milled, idle running between batches |
| Beverages and juices | Process water, CIP, rinsing, RO polishing, boilers and cooling | Water balance per line, CIP per cycle, RO recovery |
| Dairy and ghee | Steam, refrigeration, CIP water | Steam per batch, refrigeration efficiency, CIP water |
| Edible oil refining | Steam, vacuum systems, cooling loads | Steam and power per tonne refined, cooling tower make-up |
| Personal and home care | Process water, mixing power, compressed air | Water per batch, compressed air demand by shift |
| Packaging and utilities | Boilers, compressors, STP, RO, cooling towers | Steam, air and treated water supplied to every other unit |
Why a campus of plants is hard to run as one
Each unit meters its own bill, but nobody sees the campus as a single, comparable system.
Units that cannot be compared
A large unit and a small, intense unit show up as two totals. Intensity per tonne or litre is never worked out.
Shared utilities, no allocation
Steam, compressed air and treated water come from a central utilities block, and every unit disputes its share.
Losses between the meters
Water and power lost between the main incomer and the units sits in nobody's budget.
Disclosure from spreadsheets
BRSR and other water and energy disclosures are compiled by hand from bills and logbooks.

How Aqueduct rolls out across an FMCG campus
Start with one high intensity unit, prove it, then scale in waves.
Survey the pilot unit
Map meters, panels and taps, check wireless coverage and pull 12 months of water and power bills for the baseline.
Plan the instrumentation
A sensor list, gateway layout and water balance model go to the campus team for sign off.
Meter in phases
Non intrusive flow, pressure, level and power sensors go in through partners, without interrupting production.
Go live on the twin
The water and electric digital twins go live for the pilot unit, with first losses named and priced.
Scale unit by unit
Each new unit follows the same template, until every unit sits on one portfolio, ranked and benchmarked.
One live campus, unit by unit
The same platform, from the pilot plant to the whole campus.
Intensity per unit of output
Water and energy per tonne, per litre or per batch, so small intense units cannot hide behind big ones.
Shared utility allocation
Steam, compressed air and treated water metered at each unit boundary and allocated on measured use.
Live water and electric twins
Supply equals use plus loss for water, and sources equal loads plus losses for power, updated every 60 seconds.
Report ready records
aQ Assurance keeps line level, timestamped records for BRSR and other disclosures your team files.
Learn moreWhere teams put it to work
The pilot plant with the clearest story
Process water, CIP, rinsing, RO polishing, boilers and cooling sit under one roof, so a beverage plant proves the water and thermal story fastest.
Learn more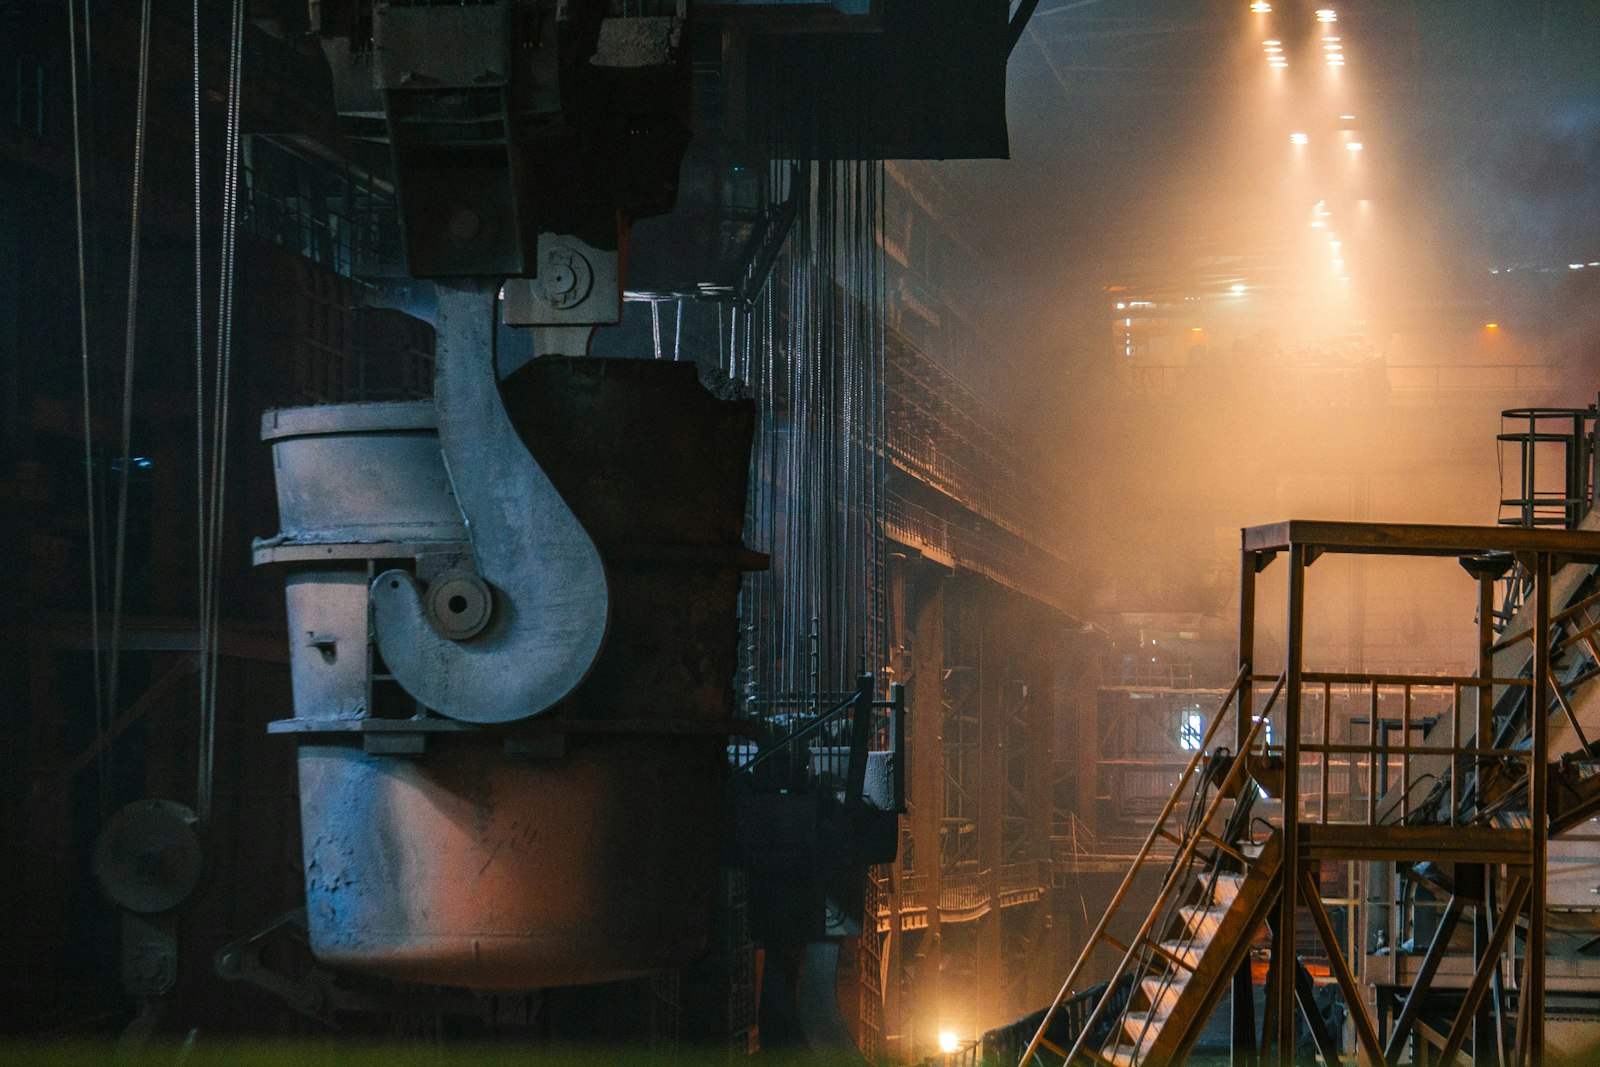
Steam and cooling per tonne refined
Refining, deodorizing and cooling loads are measured against throughput, so steam and power per tonne become numbers the plant manages.
Learn more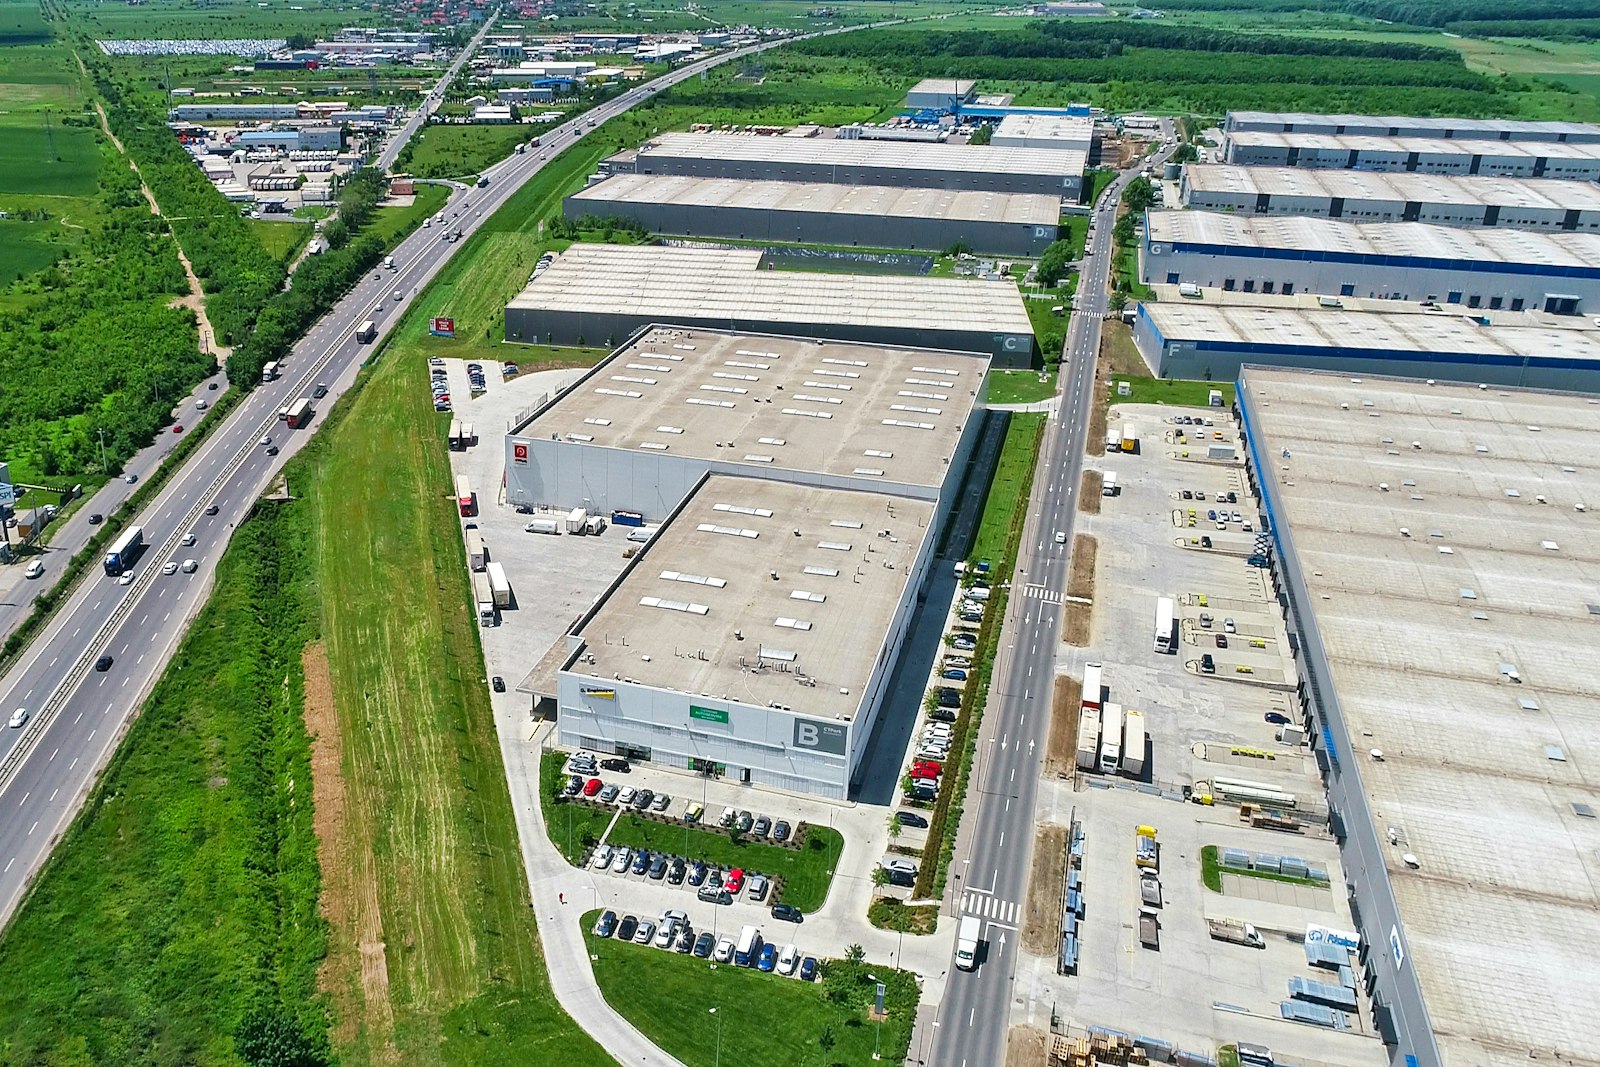
From one unit to one campus view
A 300-acre FMCG manufacturing campus with 8 business units is scoped to start with one plant and scale in waves to every unit.
Learn moreRelated
Common questions
It is the continuous measurement of water, electricity, steam and compressed air across the units of an FMCG manufacturing site. Aqueduct adds baselines per unit, intensity per unit of output and verified savings, so the campus can act on what it measures.
Meter steam, compressed air, chilled water and treated water at each unit boundary, then allocate the central utilities block's cost on measured use. Aqueduct does this from live data, so allocation reflects what each unit actually drew that month.
Specific energy consumption is energy used per unit of output, such as kWh per tonne or per thousand litres. Aqueduct calculates it per unit and per line where production data is shared, so plants of different sizes can be compared fairly.
With one self-contained, high intensity unit, often beverages or dairy, where process water, CIP, boilers and cooling all sit under one roof. Aqueduct proves the approach there, then repeats it unit by unit.
Yes. Aqueduct is scoped for a 300-acre FMCG manufacturing campus with 8 business units, from grain milling and dairy to beverages, edible oils and personal care, starting with one pilot plant.
No. Aqueduct works alongside SCADA and historians, reading their data while control stays with SCADA. It can share measured utility use with your ERP for cost allocation.
Aqueduct supplies the measured water withdrawal, consumption, discharge, reuse and energy data that BRSR disclosures draw on. Your sustainability team prepares and files the report.
See Aqueduct on your own facility.
Bring a site, a utility bill or a question. We will show you where the loss is.