What the ideal stadium management system looks like, from dark day to final whistle
 Milvian AI teamFacilities and infrastructure intelligence
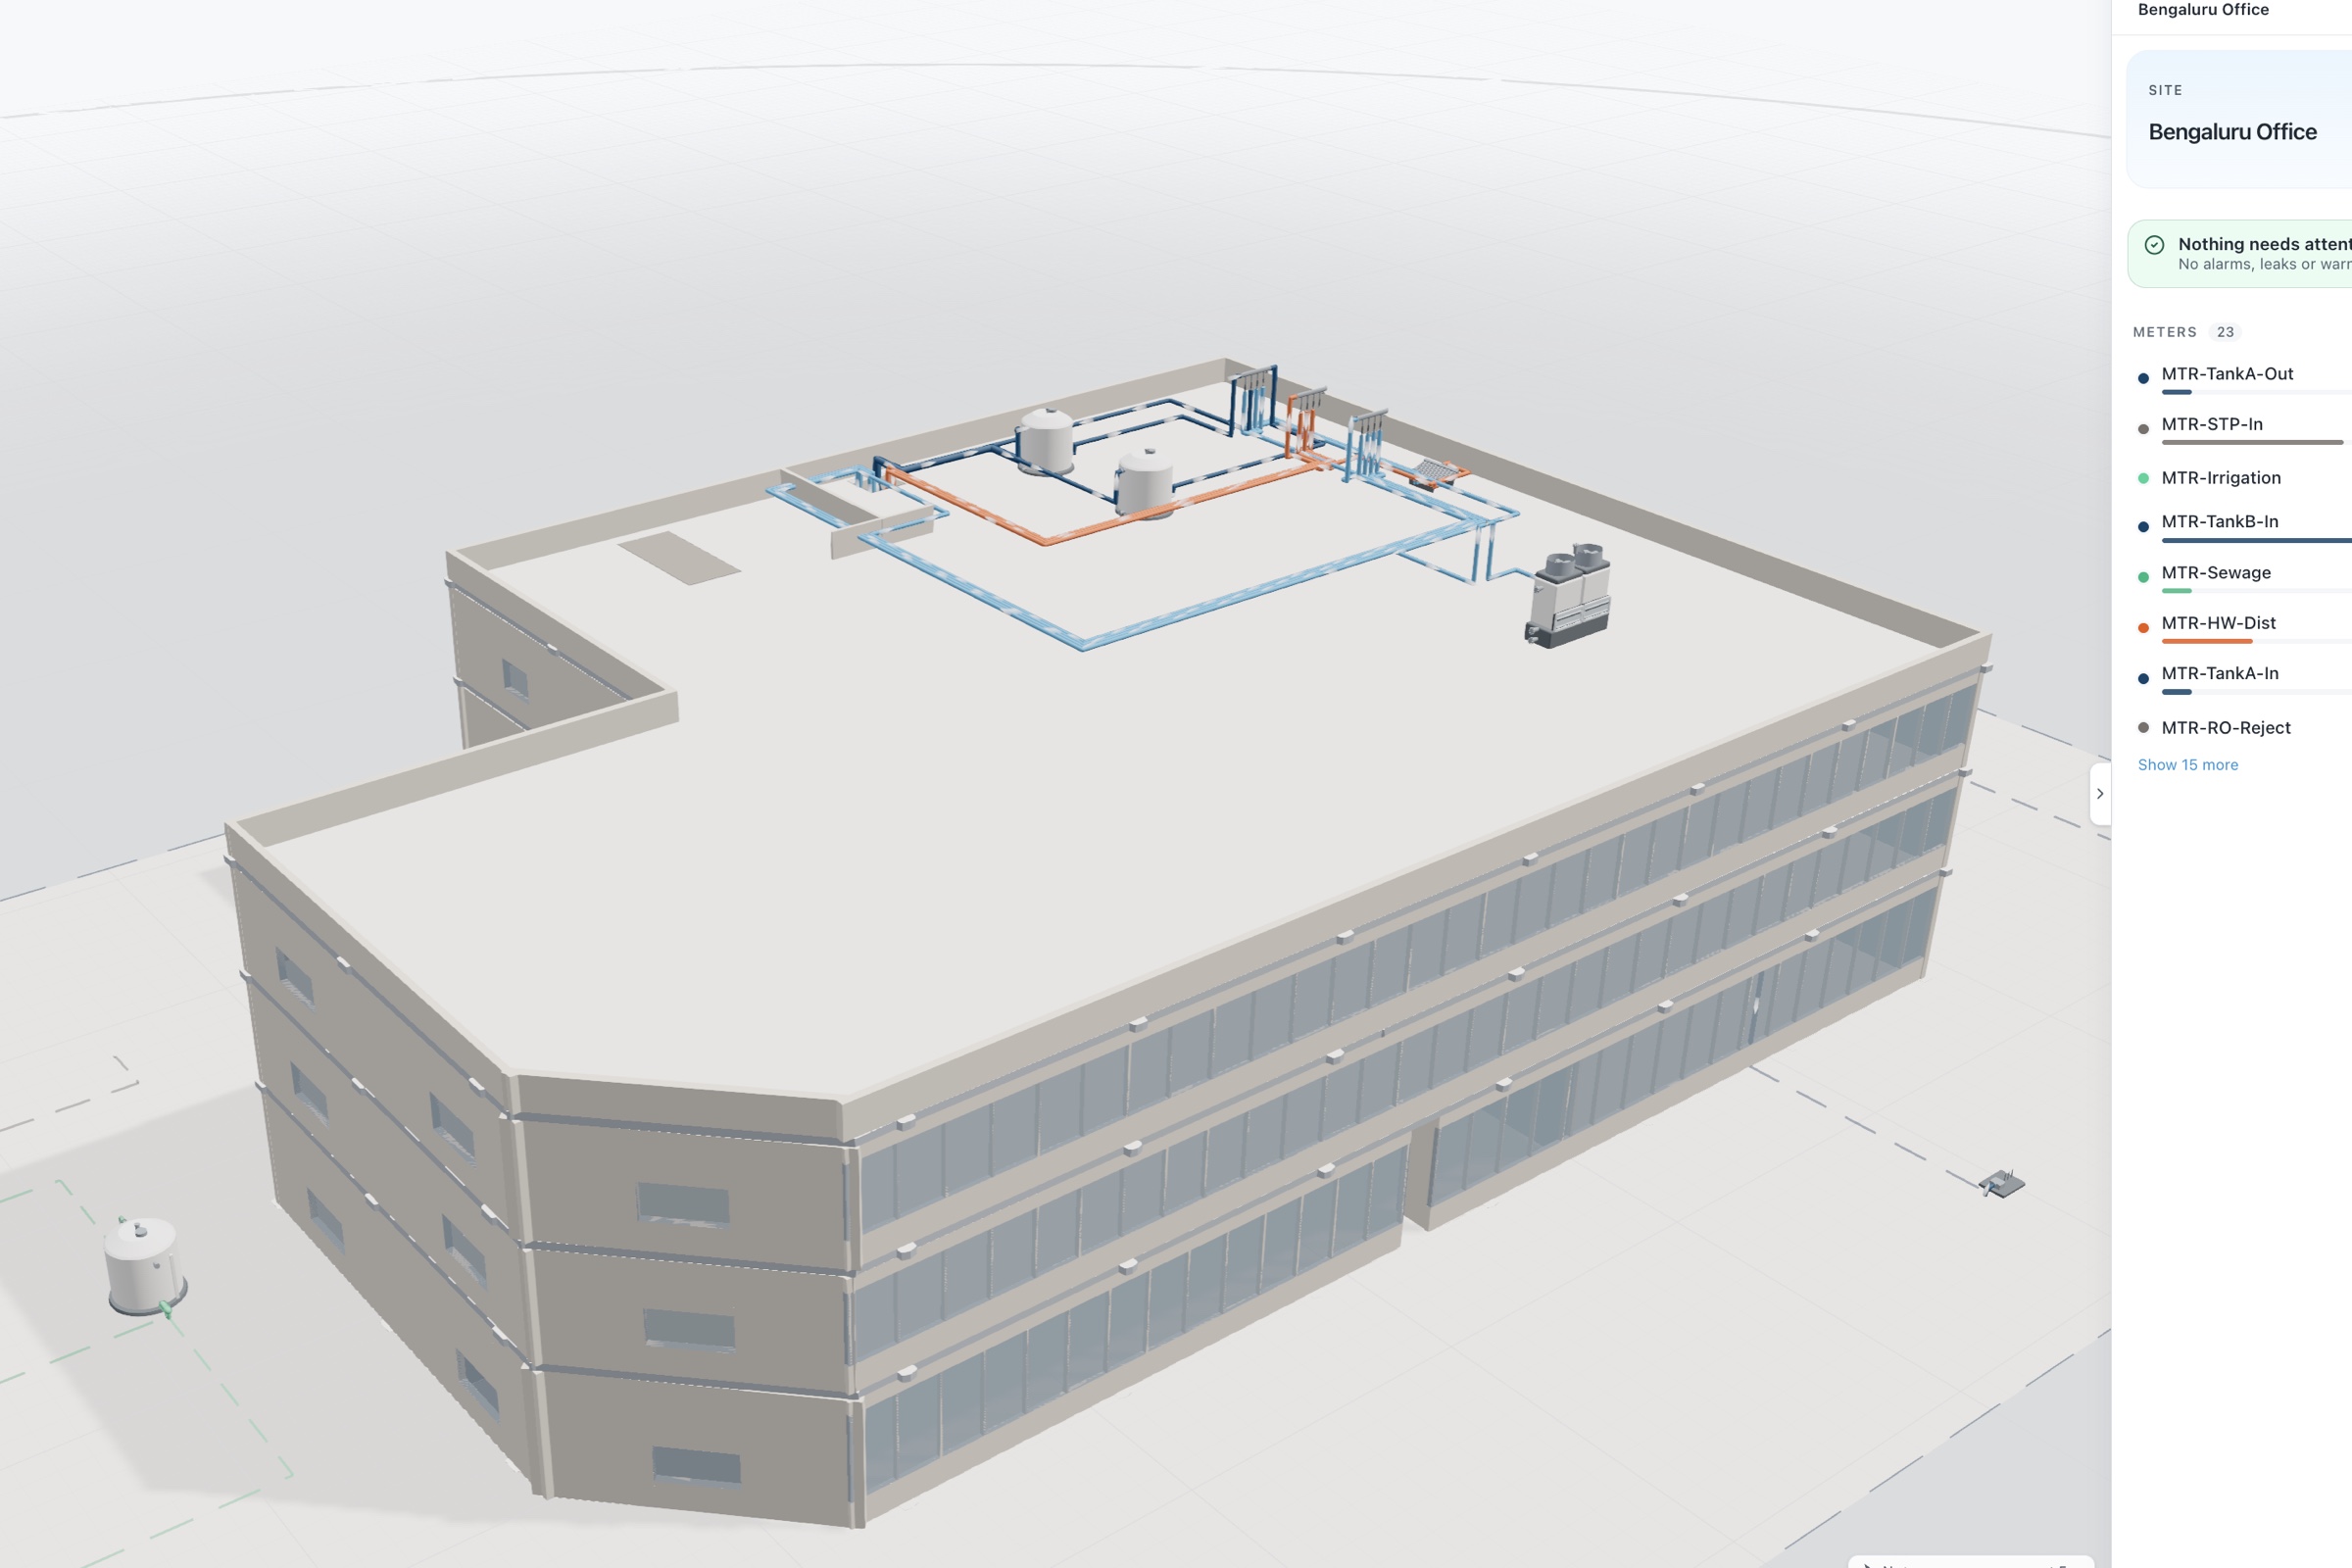
The ideal stadium management system holds one live model of the venue, knows the event calendar, and baselines each kind of day separately. It plans start-up against demand limits, follows water by stand and irrigation zone, tracks crowd air quality by zone, routes faults to the CMMS and acts on cooling, lighting and ventilation only where control is enabled, with owner approval, with every command logged.
Why a stadium needs its own kind of management system
Stadium operators already run plenty of systems: ticketing, access control, security, broadcast, catering, staffing, a BMS for the plant and a CMMS for maintenance. What most venues lack is the layer that knows what the building itself is doing, across energy, water and air, and ties it to the calendar of events that drives everything.
That gap is expensive in ways nobody sees on a match day. The plant starts early to be safe and sets a demand peak. Floodlights warm up longer than needed. A concourse restroom block leaks through a dark week. Concession refrigeration fails on a Tuesday and stock is lost before the Saturday fixture. Each problem is small. Together they decide the venue's utility bill and a good part of its maintenance workload.
The ideal stadium management system is not a bigger BMS. It is an operating view of the venue: what every system is doing, what it should be doing for today's kind of day, and what to change. The rest of this guide describes what that looks like and how to judge whether a product delivers it.
What the ideal stadium management system must do
| Capability | Why it matters in a stadium | Question to ask a vendor |
|---|---|---|
| One live model of the venue | Stands, levels, concourses, suites and plant must be seen as one place | Show me my venue by stand, level and zone, with every meter and sensor placed |
| Event-aware baselines | Match days, dark days and setup days are not comparable | How does the event calendar feed your baselines |
| Demand planning | One bad start-up sets a peak for months | Can you model the match day load and plan start-up against it |
| Water by stand and irrigation zone | Leaks and stuck valves hide behind event swings | How do you find abnormal flow on dark days and at night |
| Crowd air quality | Concourses and suites fill faster than any building | How do you measure CO2 and comfort by zone during events |
| Refrigeration and equipment watch | Failures between events cost stock and readiness | How are faults on non-event days alerted and routed |
| Governed control | Nothing may fail on match day | What approval, lockouts and command history come with control |
| Per-event reporting | Owners, leagues and sponsors ask what each event used | Can you report energy, water and air per event |
An event day in the ideal system
- The day beforeThe calendar marks a match day. The system loads the match day baseline, checks every sensor's health and lists any open faults that could affect readiness.
- Before gates openPre-cooling and ventilation start on a staggered plan, where control is enabled, with owner approval, so the venue is ready without every load starting at once.
- During the eventFeeder demand is watched against the limit, CO2 by zone shows where fresh air is needed and restroom flow is tracked block by block.
- After the final whistlePlant steps down on a planned sequence. The event's energy and water are booked against its baseline and reported.
- The dark days that followNight flow and plant runtime are compared with the dark day baseline, and anything still running without reason becomes a ticket.
The categories of tools venues compare
- Traditional BMSReliable schedules and plant control. Not event-aware, limited metering, little water coverage.
- Venue operations platformsExcellent for staffing, events and incidents. Not connected to plant, meters or water.
- Lighting and show controlPrecise control of floodlights and effects. Energy cost and run hours rarely reported against events.
- Energy and water dashboardsShow consumption after the fact. Cannot plan start-up or act.
- Facility intelligence platformsOne data layer across plant, feeders, water, irrigation and air, with event-aware baselines, digital twins and governed control.
How to judge a stadium management system
- Bring a season of dataUtility bills and the event calendar for the last season let a vendor show event-aware baselines on your own venue.
- Ask for a match day replayAsk to see how the system would have shown a past match day: start-up, peak, crowd air and water.
- Test the dark day viewA dark day exposes waste most clearly. Ask what it would flag.
- Pilot through a run of fixturesMeasure results against the right day type, with targets agreed in advance.
Scorecard for a stadium management system
| Criterion | Weight | What good looks like |
|---|---|---|
| Venue model and digital twins | High | Stands, levels and plant modeled, with live energy and water twins |
| Event-aware baselines | High | Separate baselines per day type, from the calendar |
| Demand planning | High | Match day load modeled and start-up staggered |
| Water and irrigation | Medium | Flow by stand and zone, dark day leak detection |
| Crowd air quality | Medium | CO2 and comfort by zone, exposure per event |
| Control governance | Medium | Approval, lockouts and command history |
| Per-event reporting | Medium | Energy, water and air reported per event |
Integration and data
The ideal system reads what the venue already has. The BMS and plant controllers usually speak BACnet or Modbus. Lighting and irrigation controllers can often be read, and where they cannot, metering their supply shows what they did. LoRaWAN meters and sensors cover large open structures without new cabling, and LoRaWAN relays switch simple loads such as exhaust fans and lighting circuits.
The event calendar should flow in automatically, and the CMMS should receive findings as tickets. Concession operators can be sub-metered so their use is billed fairly and their refrigeration watched between events.
Reporting and compliance a venue faces
- Per-event sustainabilityLeagues, owners and sponsors increasingly ask for energy and water per event. Metered data per day type makes those figures defensible.
- Building certificationLEED for operations and maintenance and ENERGY STAR benchmarking may apply, depending on location.
- Indoor airASHRAE 62.1 sets ventilation expectations for occupied spaces such as suites, offices and concourses.
- Water reportingIn dry climates, reporting by source and use matters as much as energy.
Where Aqueduct fits
Aqueduct is built to be that operating view. aQ Core holds the venue as sites, floors, zones and devices on real floor plans. aQ EnergySmart provides the electrical digital twin with feeder demand and weather-normalized baselines by day type, aQ WaterGuard shows the live water balance by stand, irrigation zone and source, and aQ AirSafe tracks CO2 and comfort by zone with occupancy overlaid.
Smart Controls groups units and sensors into control clusters, runs schedules and occupancy-driven automations, and acts through Modbus and BACnet field devices or LoRaWAN relays, where control is enabled, with owner approval. Lockouts protect equipment and the command history shows every command and whether it executed. aQ Assistant answers questions such as how this match day compared with the last three, in plain language. Aqueduct runs at 275+ sites in 21 countries.