The best indoor air quality monitoring system for offices and schools
 Milvian AI teamFacilities and infrastructure intelligence
The best indoor air quality monitoring system for offices and schools measures CO2, particulates, VOCs, temperature and humidity in every occupied zone, reads occupancy alongside, and judges exposure by duration as well as level. It shows sensor health, explains each finding in plain language against a named standard, routes fixes to facilities, and supports ventilation changes where control is enabled, with owner approval.
Why offices and schools are a hard case for air quality
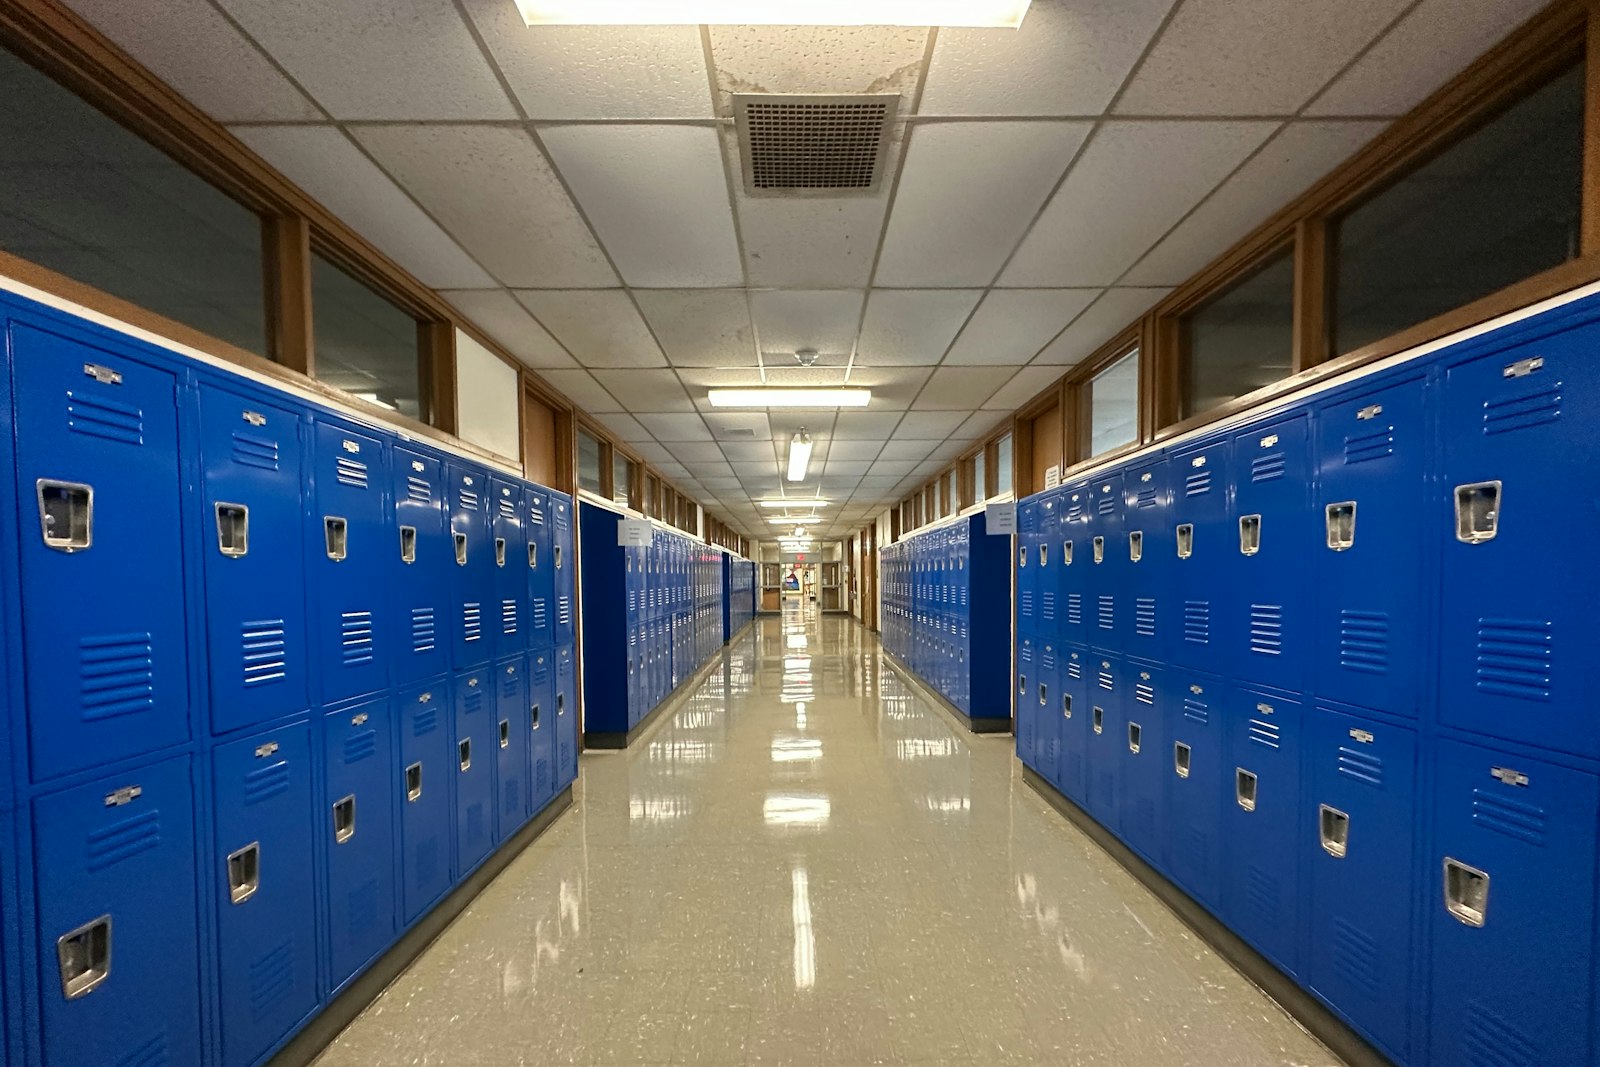
Offices and schools fill and empty on a timetable. A classroom goes from empty to full in minutes, then empties for a break. A meeting room that was fine at nine can be stuffy by ten. Open plan floors are lightly used on some days and packed on others. Ventilation, however, is often set once at commissioning and left, so some spaces get too little fresh air when crowded and others get far more than they need when empty.
The other sources of poor air are less obvious. Cleaning products raise VOCs in the evening. Printers, new furniture and renovation release their own. Traffic or wildfire smoke can push outdoor particulates inside when the outdoor air is worse than the indoor air. Without continuous measurement, these show up only as complaints of headaches, drowsiness or stale air.
A single monitor in a lobby, or a handheld survey once a year, cannot see any of this. What helps is a measurement per occupied zone, read against occupancy and time, with findings people can act on.
Schools add their own pressures. Teachers notice drowsy classes after lunch, parents ask what the air is like, and boards want to show they are acting. Budgets are tight and estates are old, with natural ventilation in some blocks and mechanical systems in others. An office landlord faces a different version of the same question from tenants deciding whether to renew. In both cases the data has to be credible, easy to read and tied to something the facilities team can actually change.
What the best IAQ monitoring system for offices and schools must do
| Requirement | Why it matters in offices and schools | Question to ask a vendor |
|---|---|---|
| Measure per occupied zone | Classrooms and meeting rooms behave differently from the floor average | How many sensors per zone type, and what does each measure? |
| Read occupancy alongside air | High CO2 in an empty room does not matter; in a full one it does | Can you overlay occupancy from sensors or schedules? |
| Judge duration, not just peaks | Exposure over time is what affects people | Do you track exposure in zone-hours or similar? |
| Explain findings against a standard | Facility teams and parents need a reason, not a color | Does each finding name the standard and a recommended action? |
| Show sensor health | A dead sensor looks like clean air | Can I see connection and battery health per device? |
| Compare across buildings | Districts and portfolios need to prioritize | Can sites be ranked and filtered by type and region? |
| Route fixes | A finding with no owner changes nothing | Do findings reach facilities or the CMMS? |
| Support ventilation control | Measured air should drive fresh air supply | Can you act on ventilation where control is approved, with a command log? |
The categories of IAQ tools buyers compare
- Consumer and desktop monitorsCheap and quick, good for raising awareness in one room. Data rarely leaves the device or joins a portfolio view.
- BMS sensorsReturn air CO2 and temperature help control air handlers. They usually measure the duct, not the room people sit in, and rarely cover particulates or VOCs.
- IAQ dashboard platformsGood room-level charts from a vendor's sensors. Many stop at display, without occupancy, energy context or control.
- Periodic IAQ surveysConsultants with calibrated instruments give a defensible snapshot. A snapshot misses the nightly cleaning spike and the crowded afternoon.
- Facility intelligence platformsAir, occupancy, energy and control on one data layer, so a ventilation change can be judged on air quality and energy together.
How to evaluate an IAQ monitoring system
- Pick representative spacesA full classroom, a gym, a staff room, a busy meeting room, an open plan floor and a reception. Avoid sampling only the easy rooms.
- Check the air handlers that serve themNote outdoor air settings, economizers and schedules. This tells you what can change if the data shows a problem.
- Run a four to eight week pilotLong enough to see weekly patterns, cleaning cycles and a change in weather.
- Read the findings, not the chartAsk which zones breached, for how long, during which occupied hours, and what the recommended fix is.
- Test one changeAdjust ventilation in one zone, with approval, and check that air improved and energy stayed reasonable.
IAQ monitoring scorecard
| Criterion | Weight | What good looks like |
|---|---|---|
| Parameter coverage | 15% | CO2, PM2.5, VOC index, temperature and humidity per zone |
| Occupancy context | 20% | Air read against occupancy from sensors or schedules |
| Exposure and explanation | 20% | Duration-aware ratings with the standard and a recommended action |
| Data quality | 15% | Sensor health visible, gaps flagged |
| Portfolio view | 10% | Buildings ranked and filtered by type and region |
| Action and control | 20% | Findings routed, ventilation adjustable where approved, every command logged |
Integration and data
Most offices and many schools already have a BMS, at least on central plant. The monitoring layer reads it over BACnet or Modbus to see air handler status, outdoor air damper position and setpoints. Room sensors are usually wireless LoRaWAN devices, which can be fitted in occupied buildings without cabling and run for long periods on batteries.
Occupancy can come from motion or people-counting sensors, or from a timetable. Both are useful: the timetable says when a room should be full, and sensors say when it actually was. Findings route to the facilities team or CMMS. Where control is enabled, with owner approval, commands go through the BMS or directly to simple equipment such as exhaust fans.
For school districts and office portfolios, the portfolio view matters as much as the room view. Buildings can be ranked by how often and how long zones breach during occupied hours, filtered by building type or region, and exported. That turns a district wide concern into a short list of buildings and rooms where ventilation work or a change in schedule will help most.
Standards and frameworks for indoor air
- ASHRAE 62.1Sets minimum ventilation rates for acceptable indoor air quality in commercial and institutional buildings.
- WELLIncludes air quality performance requirements, with ongoing monitoring options.
- LEED O+MRewards indoor environmental quality performance measured in operation.
- Schools guidanceMany education authorities publish ventilation and CO2 guidance for classrooms; BB101 in England is one example.
Where Aqueduct fits
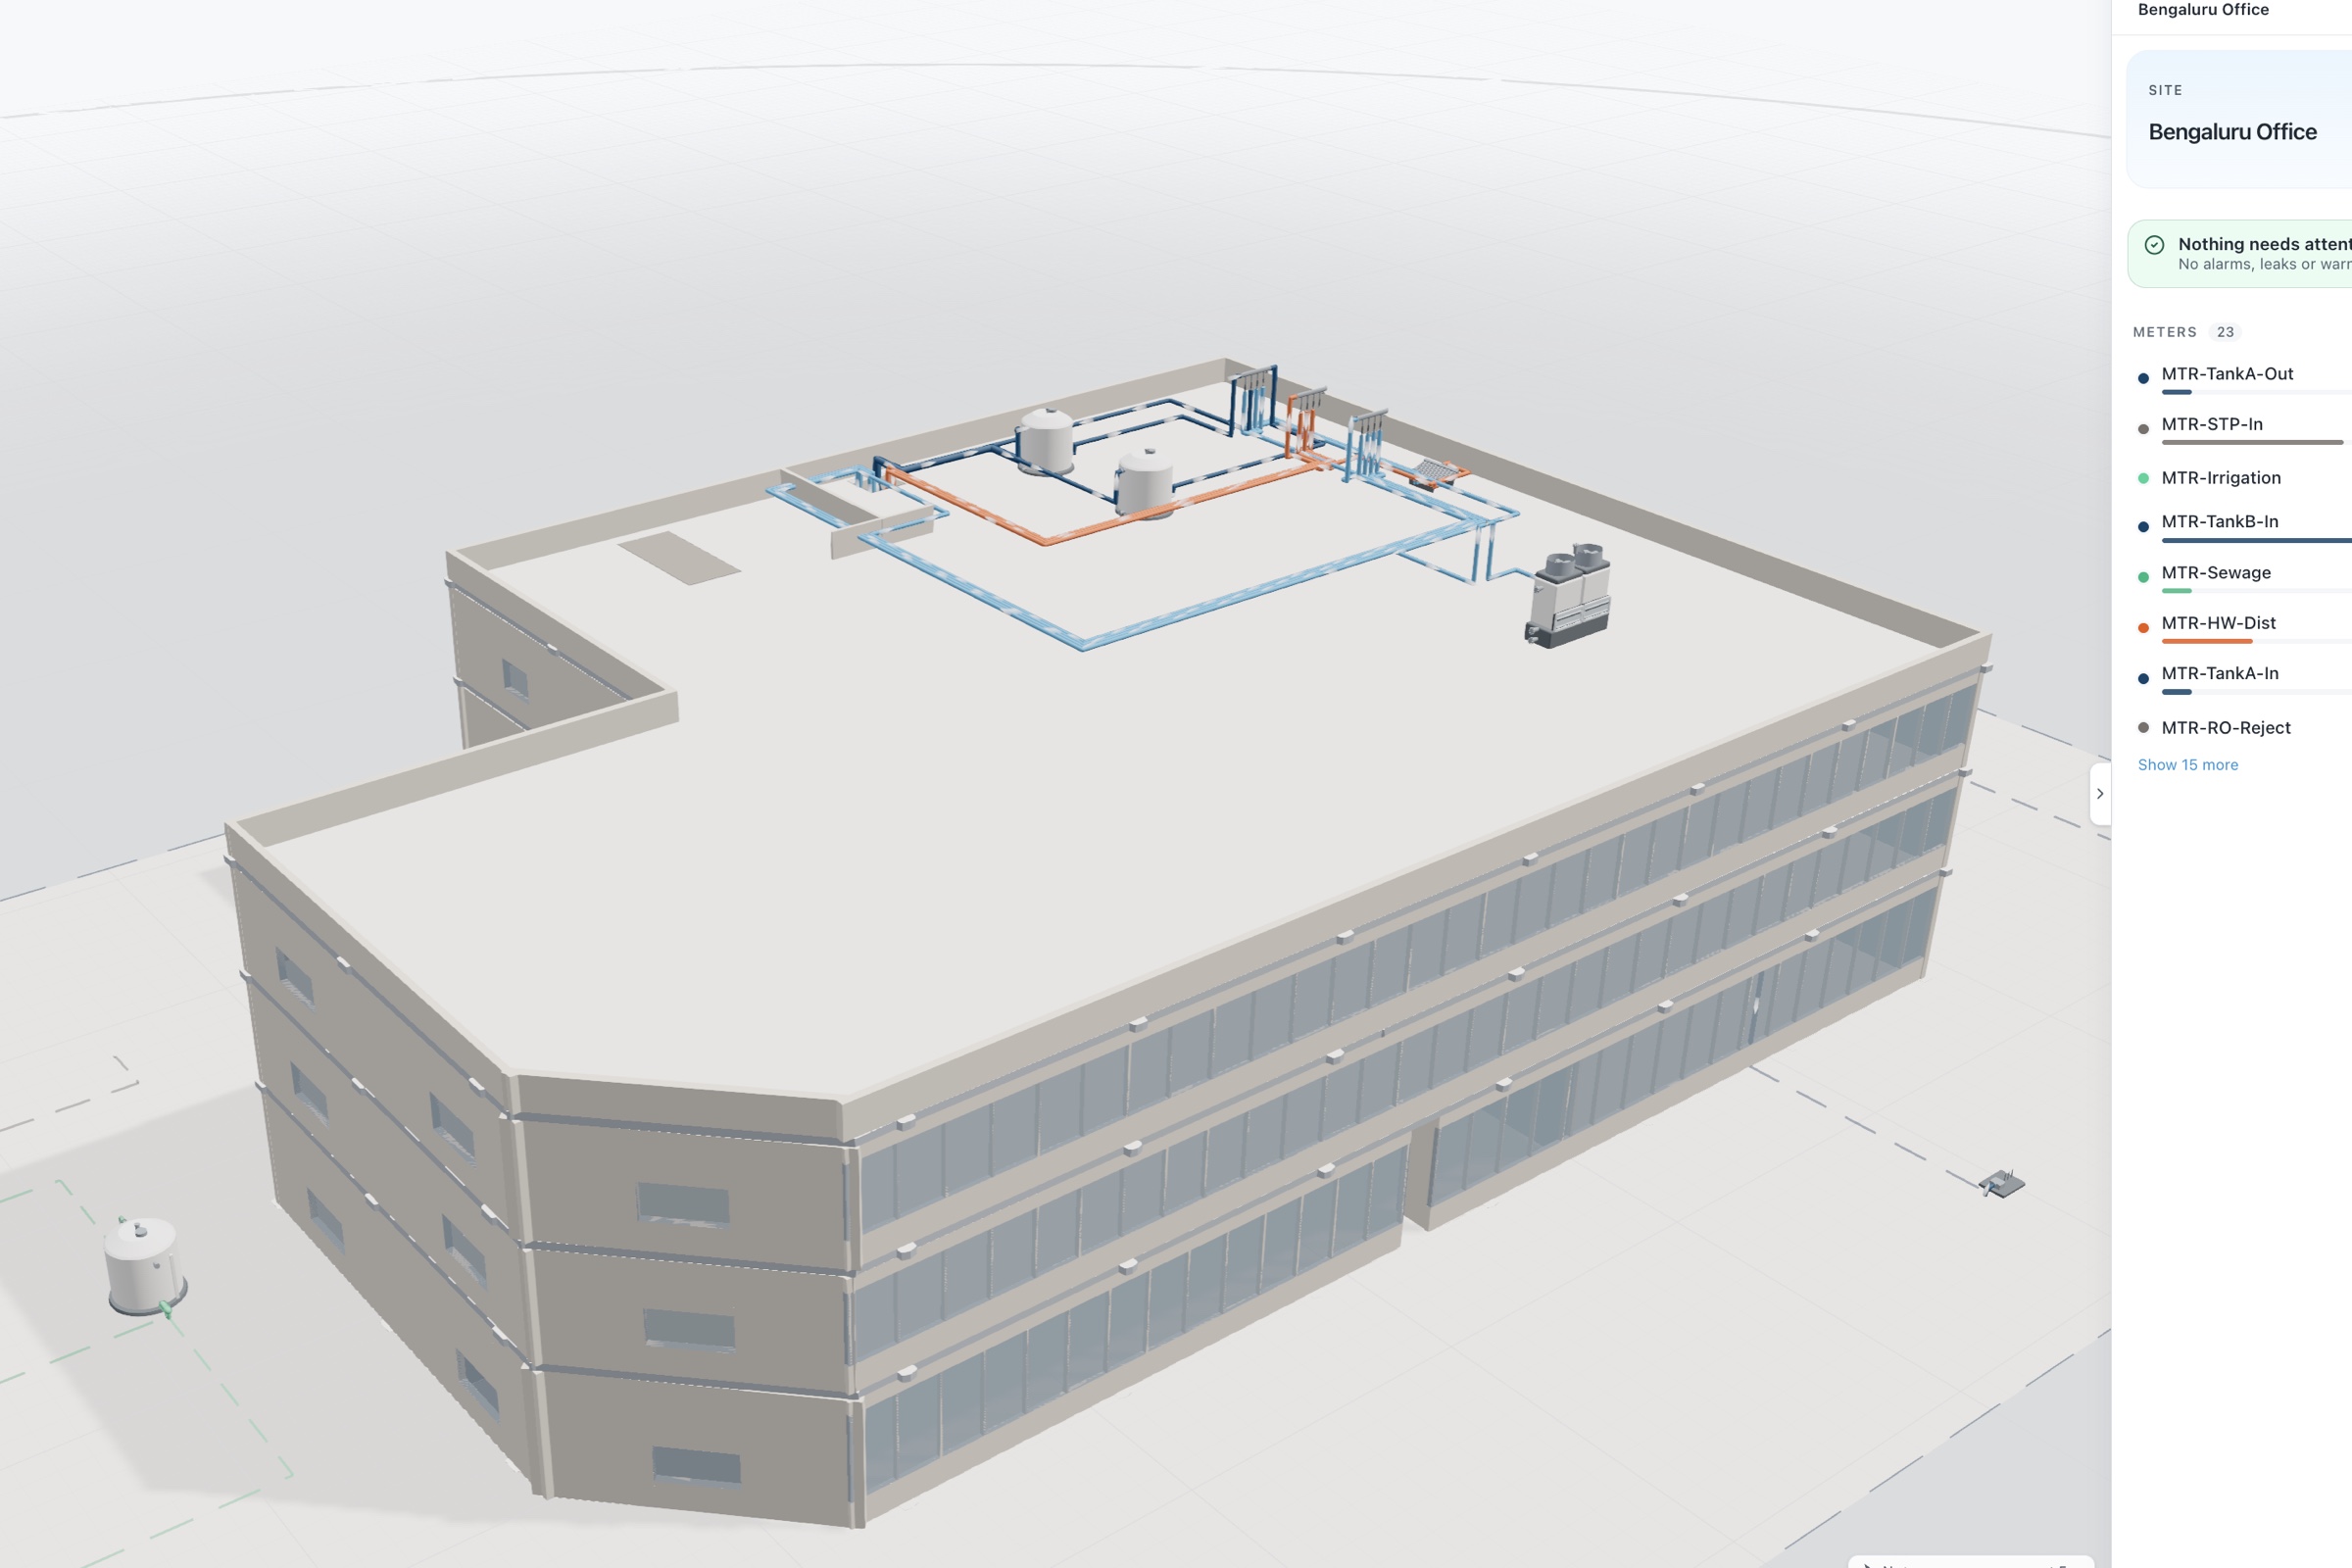
aQ AirSafe measures CO2, VOC index, particulates, temperature, humidity and more per zone, overlays them with occupancy, and tracks exposure in zone-hours. Each finding comes with the standard behind it, the likely cause and a recommended action, including whether outdoor conditions make more fresh air cheap right now. aQ Core maps every sensor to its floor and zone and shows its health. Portfolios and districts can rank every building.
Where control is enabled, with owner approval, Smart Controls can run demand-controlled ventilation through the existing BMS or field devices, with occupancy driving the rules and every command logged. Lockout protection stops new commands while an earlier one is still being acted on, which protects equipment from short cycling. aQ EnergySmart shows the energy effect of each change. Owners can keep their BMS, replace it, or build monitoring into a new building.