The best ESG data platform for real estate portfolios: metered, normalized and ready for assurance
 Milvian AI teamFacilities and infrastructure intelligence

The best ESG data platform for a real estate portfolio collects energy, water and waste data for every asset from meters and bills, marks what is measured versus estimated, normalizes for weather and occupancy, and keeps an audit trail an assurer can follow. It reports into GRESB, CSRD, ENERGY STAR Portfolio Manager and performance standards, and points to the buildings where action moves the numbers.
Why real estate portfolios are a hard case for ESG data
A portfolio is a mix of ownership and control. In multi-let offices the landlord controls the base building and the tenants control their own space. In single-let industrial assets the tenant may control everything. Utility accounts are split between landlord and tenant, meters are shared, and data arrives as bills in different formats, from different suppliers, on different cycles.
The reporting load keeps growing. Investors ask for GRESB. European entities face CSRD. A growing number of cities, New York among them, now set building performance standards with penalties. Lenders ask for energy intensity. Each framework wants coverage, consistency and an audit trail, and each penalizes estimates in its own way.
Most portfolios answer with a reporting tool fed by spreadsheets and a bill collection service. That produces a report. It does not tell the asset manager why a building's intensity went up, whether the weather explains it, or which fix would move the number. The best ESG data platform does both: it produces the report and it makes the data useful for operations.
There is also a timing problem. Most ESG data is assembled once a year, months after the period closes. By then a failed economizer or a tenant running equipment overnight has been costing money and carbon for most of a year. Data that arrives monthly or daily, normalized and compared with expected use, lets the asset manager act while it still changes the annual figure.
What the best ESG data platform for real estate must do
| Requirement | Why it matters in real estate | Question to ask a vendor |
|---|---|---|
| Cover landlord and tenant data | Frameworks ask for whole building coverage | How do you collect tenant-controlled consumption? |
| Mark measured versus estimated | Assurers and GRESB treat estimates differently | Is every figure flagged by source and method? |
| Normalize for weather | A mild year flatters a portfolio that did nothing | Do you build weather-normalized baselines per asset? |
| Validate bills | Supplier errors flow straight into ESG figures | Do you check bills against meter data? |
| Go below the main meter | Asset plans need to know which system drives use | Can you add sub-meters and show use by system or tenant? |
| Keep an audit trail | Assurance needs the path from source to figure | Can an assurer trace a reported number back to its meter and bill? |
| Map to frameworks | GRESB, CSRD, ENERGY STAR and local laws ask differently | Which frameworks do you export to, and how? |
| Rank assets for action | Capital goes where the gap is largest | Can you rank assets against their own expected use? |
The categories of tools real estate teams compare
- ESG reporting and carbon accounting softwareStrong at frameworks, emissions factors and disclosures. Usually dependent on imported data, so quality is set upstream.
- Utility bill management servicesCollect and digitize bills, often across many suppliers. Monthly and whole-account, so they explain little about why use changed.
- Energy management dashboardsInterval data and charts for buildings with smart meters. Often energy only, with limited water, tenant or framework support.
- Spreadsheets plus consultantsFlexible and expert. Labor-intensive each cycle, and the audit trail lives in files.
- Facility intelligence platformsMeters, bills and building systems on one data layer, with baselines, sub-metering, tenant billing and exportable records. They feed reporting tools and frameworks with better data.
How to evaluate an ESG data platform
- Audit your current coverageFor each asset, list which utilities are covered, from which source, and what share is estimated.
- Pick a test set of assetsInclude a multi-let office, a single-let asset and a building facing a performance standard.
- Load twelve months of billsA good platform should produce weather-normalized baselines on day one from bills alone.
- Add metering where it mattersSub-meter the buildings with the largest gap or penalty exposure, and validate bills against the meters.
- Run an assurance dry runAsk an assurer or internal auditor to trace three reported figures back to source.
ESG data platform scorecard
| Criterion | Weight | What good looks like |
|---|---|---|
| Coverage | 20% | Whole building data, landlord and tenant, energy and water |
| Data provenance | 20% | Every figure flagged measured or estimated, with method |
| Normalization | 15% | Weather-normalized baselines per asset and system |
| Bill validation | 10% | Bills checked against meters, errors flagged |
| Operational insight | 15% | Sub-metering, system level use, assets ranked for action |
| Framework output | 20% | Clean exports for GRESB, CSRD, ENERGY STAR and local laws |
Integration and data
Portfolio data comes from many places: utility bills and supplier portals, smart and AMR meters, BMS in larger buildings, and tenant meters. A good platform reads meters and controllers over Modbus and BACnet, accepts bill uploads, and adds wireless LoRaWAN sub-meters where coverage is thin. It does not require replacing the BMS.
Downstream, it should feed rather than replace the reporting stack. Exports go to ENERGY STAR Portfolio Manager, GRESB submissions and the carbon accounting tool. Tenant data supports green lease clauses and recharges. Findings that need fixing go to the property manager's CMMS.
Provenance should be kept from the first step. When a figure comes from a meter, the platform should know which meter, its data coverage for the period and whether any days were filled. When it comes from a bill, the bill should be stored with it, and a validation against meter data should show whether the supplier's figure can be trusted. That is what turns an ESG number into one an assurer can sign off without a long list of queries.
Frameworks real estate data has to serve
- GRESBAnnual assessment for real estate funds and companies, scoring data coverage and performance.
- CSRDEuropean sustainability reporting with limited assurance, which puts provenance under scrutiny.
- ENERGY STAR Portfolio ManagerThe US benchmarking tool used by many city disclosure laws.
- Building performance standardsLaws such as New York's Local Law 97 set limits with penalties, so data must be right and early.
Where Aqueduct fits
Aqueduct is a facility intelligence platform. It is not a carbon accounting tool and it does not file GRESB or CSRD submissions. It supplies the measured energy and water data those reports depend on, and makes that data useful for running the buildings.
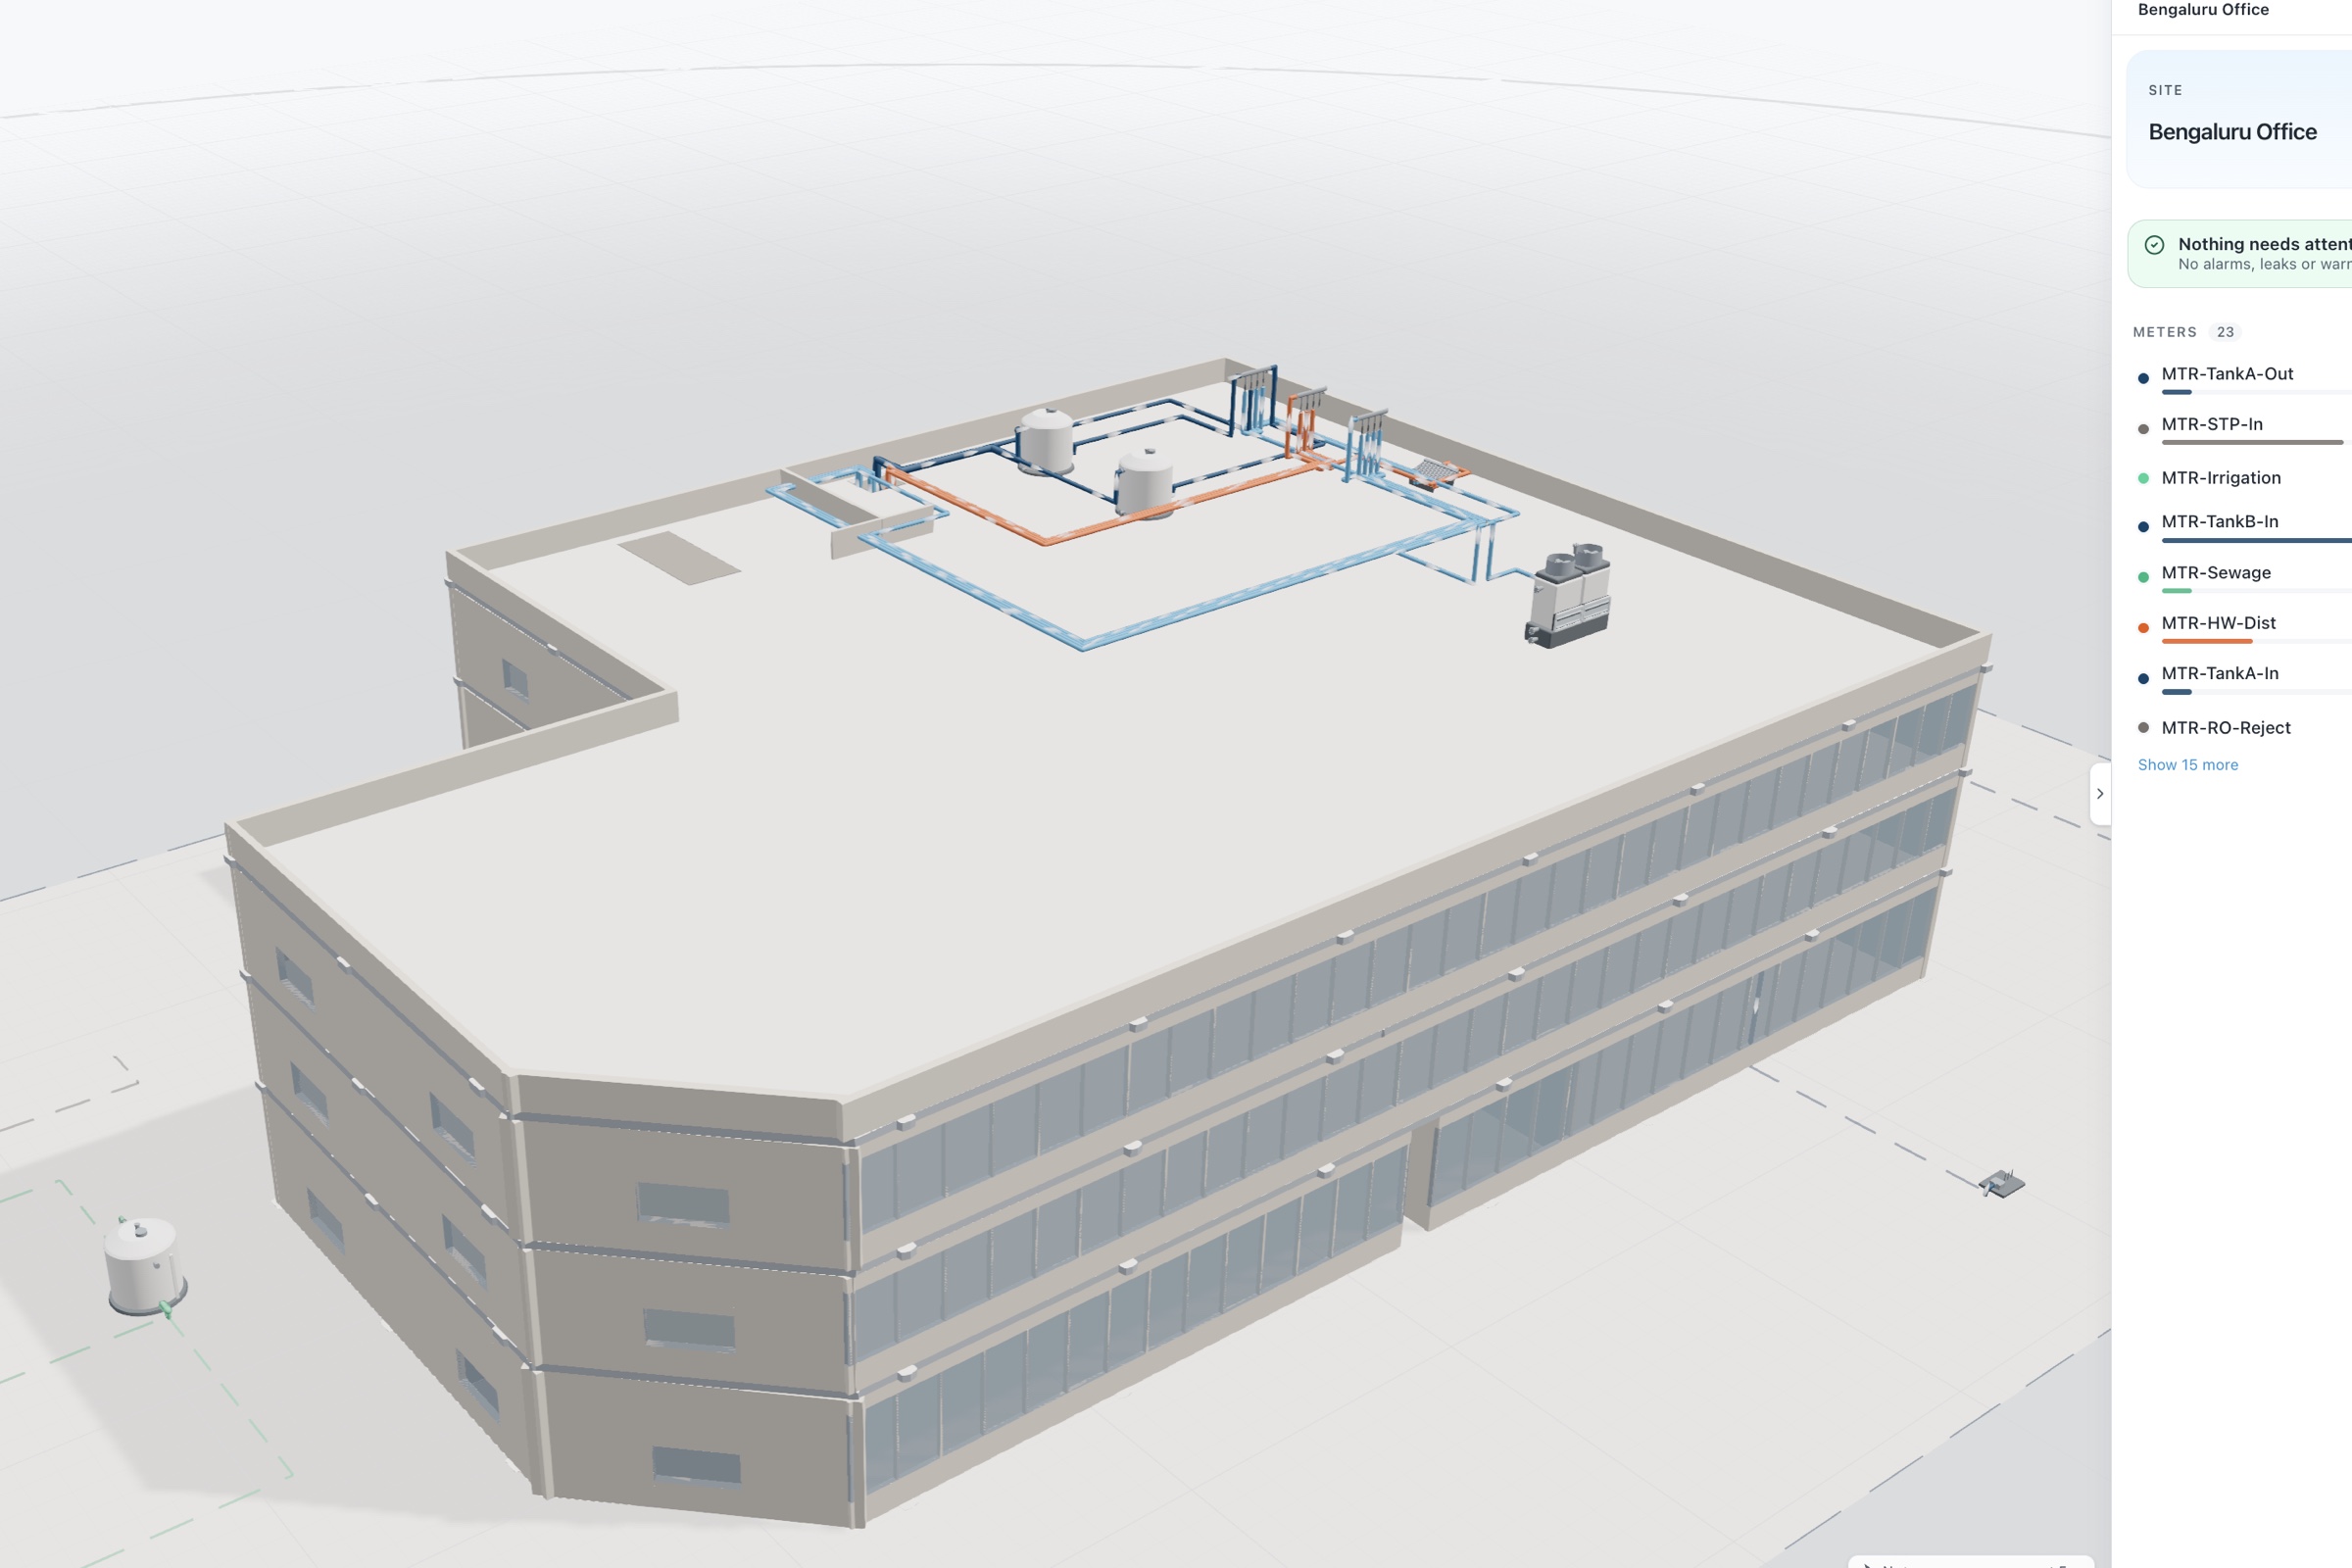
aQ Core holds every asset, meter and sub-meter in one hierarchy, with Billing Management for tenant billing, bill validation and measurement and verification. aQ EnergySmart and aQ WaterGuard build weather-normalized baselines per asset, on day one from 6 to 12 months of bills, and rate configuration turns the gap into money. Portfolio views rank every asset against its own expected use. aQ Assurance keeps the record and exports it; your team or consultant files and the assurer decides.
Aqueduct works with a commercial real estate developer with 20M+ sq ft. Owners keep their BMS and read from it, replace end-of-life systems, or build metering into new developments. Where control is enabled, with owner approval, Smart Controls can act on HVAC schedules, with every command logged.