The best energy management system software: a 2026 buyer guide
 Milvian AI teamFacilities and infrastructure intelligence
The best energy management system software meters below the main incomer, builds weather-normalized baselines (from historical bills on day one), models the electrical system from supply to feeder, diagnoses faults with a likely cause, routes them to the CMMS, prices every result in your tariff, reads the BMS you already own and, where you approve it, acts on equipment with a full audit trail.
Why choosing energy management software is harder than it looks
Almost every product in this market shows a chart of kilowatt hours. That is the easy part. The hard part is answering the questions a facility team actually asks: did we use more than we should have, which system caused it, what did it cost, and did the fix work. Those questions need a baseline that accounts for weather, metering below the main incomer, a model of how the building is wired and a method finance will accept.
Buyers also come from different starting points. A hospital engineer wants fault diagnosis on the central plant. A CRE asset manager wants a fair ranking of fifty buildings and tenant recovery. A plant manager wants energy per unit and power factor. A sustainability lead wants figures that survive an audit. The best software serves all of them from one data layer, rather than four tools that disagree.
Finally, there is control. Many tools stop at insight. Some promise automation without guardrails. The right answer sits between: awareness first, then optimization and control on equipment the owner approves, with every command recorded.
What the best energy management system software must do
| Requirement | Why it matters | Question to ask a vendor |
|---|---|---|
| Submetering below the incomer | The main meter cannot say which system moved. | How far down can you meter, and with which devices? |
| Weather-normalized baselines | Year over year comparisons are distorted by weather. | Do you regress on cooling and heating degree days for each site? |
| Day-one results from bills | Waiting a year for a baseline delays every decision. | Can we upload 6 to 12 months of bills and see performance immediately? |
| Electrical model | Losses, power factor and feeder loading hide in the totals. | Can you show an energy balance from supply sources to each feeder? |
| Fault diagnosis with causes | Alarms without causes are ignored. | Does each finding include a likely cause and evidence? |
| Money, not just kWh | Finance acts on currency. | How do you apply our tariff to the delta against baseline? |
| Open integration | Most buildings already have a BMS and meters. | Which protocols do you read, and is it read-only by default? |
| Control with an audit trail | Automation without records cannot be verified or trusted. | Is every command logged, with lockouts against short cycling? |
| Data trust | Bad data produces bad decisions. | Do you show device health and coverage per meter? |
The categories of energy management software
- Traditional BMS and BASFrom controls manufacturers. Excellent at running plant on schedules and setpoints. They rarely baseline against weather, price waste or compare sites fairly.
- Standalone EMS dashboardsClear charts of meter and bill data, often across a portfolio. Many stop at reporting, without diagnosis or a way to act.
- IoT monitoring platformsFast to deploy wireless sensors and alerts. Often thin on the physics behind the data, so alerts lack causes.
- CMMS and EAMThe system of record for assets and work orders. They do not measure the energy a fault wasted.
- Bill management services and consultantsGood at audits, tariff reviews and paying invoices. Findings arrive monthly or once, and age quickly.
- Facility intelligence platformsMetering, baselines, digital twins, diagnostics, verification and approved control on one data layer, alongside water and air.
How to evaluate energy management software
- Write down the questions you need answeredFor example: which buildings use more than expected, which systems drive it, and what it costs. Judge every vendor against those questions, not their demo.
- Share 12 months of bills for two or three sitesAsk each vendor for a weather-normalized baseline and a ranked view from your own data before any hardware is quoted.
- Check the instrumentation planA good vendor proposes specific meters and sensors where your data is blind, and reads what you already have.
- Pilot with a measured outcomeAgree one or two measures, such as plant energy against baseline, and run long enough to cover a change in season or use.
- Verify before you scaleCheck that savings are measured at the meter, priced in your tariff and that every command, if any, is in the audit log.
Energy management software scorecard
| Criterion | Weight | What good looks like |
|---|---|---|
| Baseline method | High | Regression on use plus cooling and heating degree days, explained plainly |
| Measurement depth | High | Submetering to system and feeder, with an electrical model |
| Diagnostics | High | Findings with causes, evidence and CMMS routing |
| Verification in money | High | Delta against baseline priced in your tariff |
| Integration | Medium | Reads BACnet, Modbus and existing meters, read-only by default |
| Control and audit | Medium | Owner approved scope, lockouts, command history |
| Portfolio view | Medium | Sites ranked against their own expected use |
| Water and air | Medium | Same data layer for water and indoor air |
| Data trust | Low | Device health and coverage visible |
Integration and data: keep, replace or build in
The best software fits the buildings you have. In most cases that means keeping the BMS and reading it over BACnet or Modbus, adding clamp-on current sensors, smart meters and LoRaWAN devices where it is blind, and connecting the CMMS so findings become work orders. Where meters or controls have failed, replace them. In new buildings, specify the measurement layer at design so the building starts with a baseline.
Ask about data at the boring level: how often readings arrive, how gaps are shown, how long history is kept and how data is exported. A platform that hides missing data will eventually report a saving that never happened.
Compliance and reporting
Energy software is increasingly the evidence base for reporting. ISO 50001 asks for baselines, indicators and proof of improvement. ENERGY STAR Portfolio Manager, GRESB and CSRD need measured figures by site. Building performance standards such as Local Law 97 attach penalties to measured emissions, and ASHRAE 90.1 shapes design and retrofit work.
No software makes a building compliant. Good software supplies traceable data and a documented method, and the owner, verifier or authority does the rest.
Where Aqueduct fits
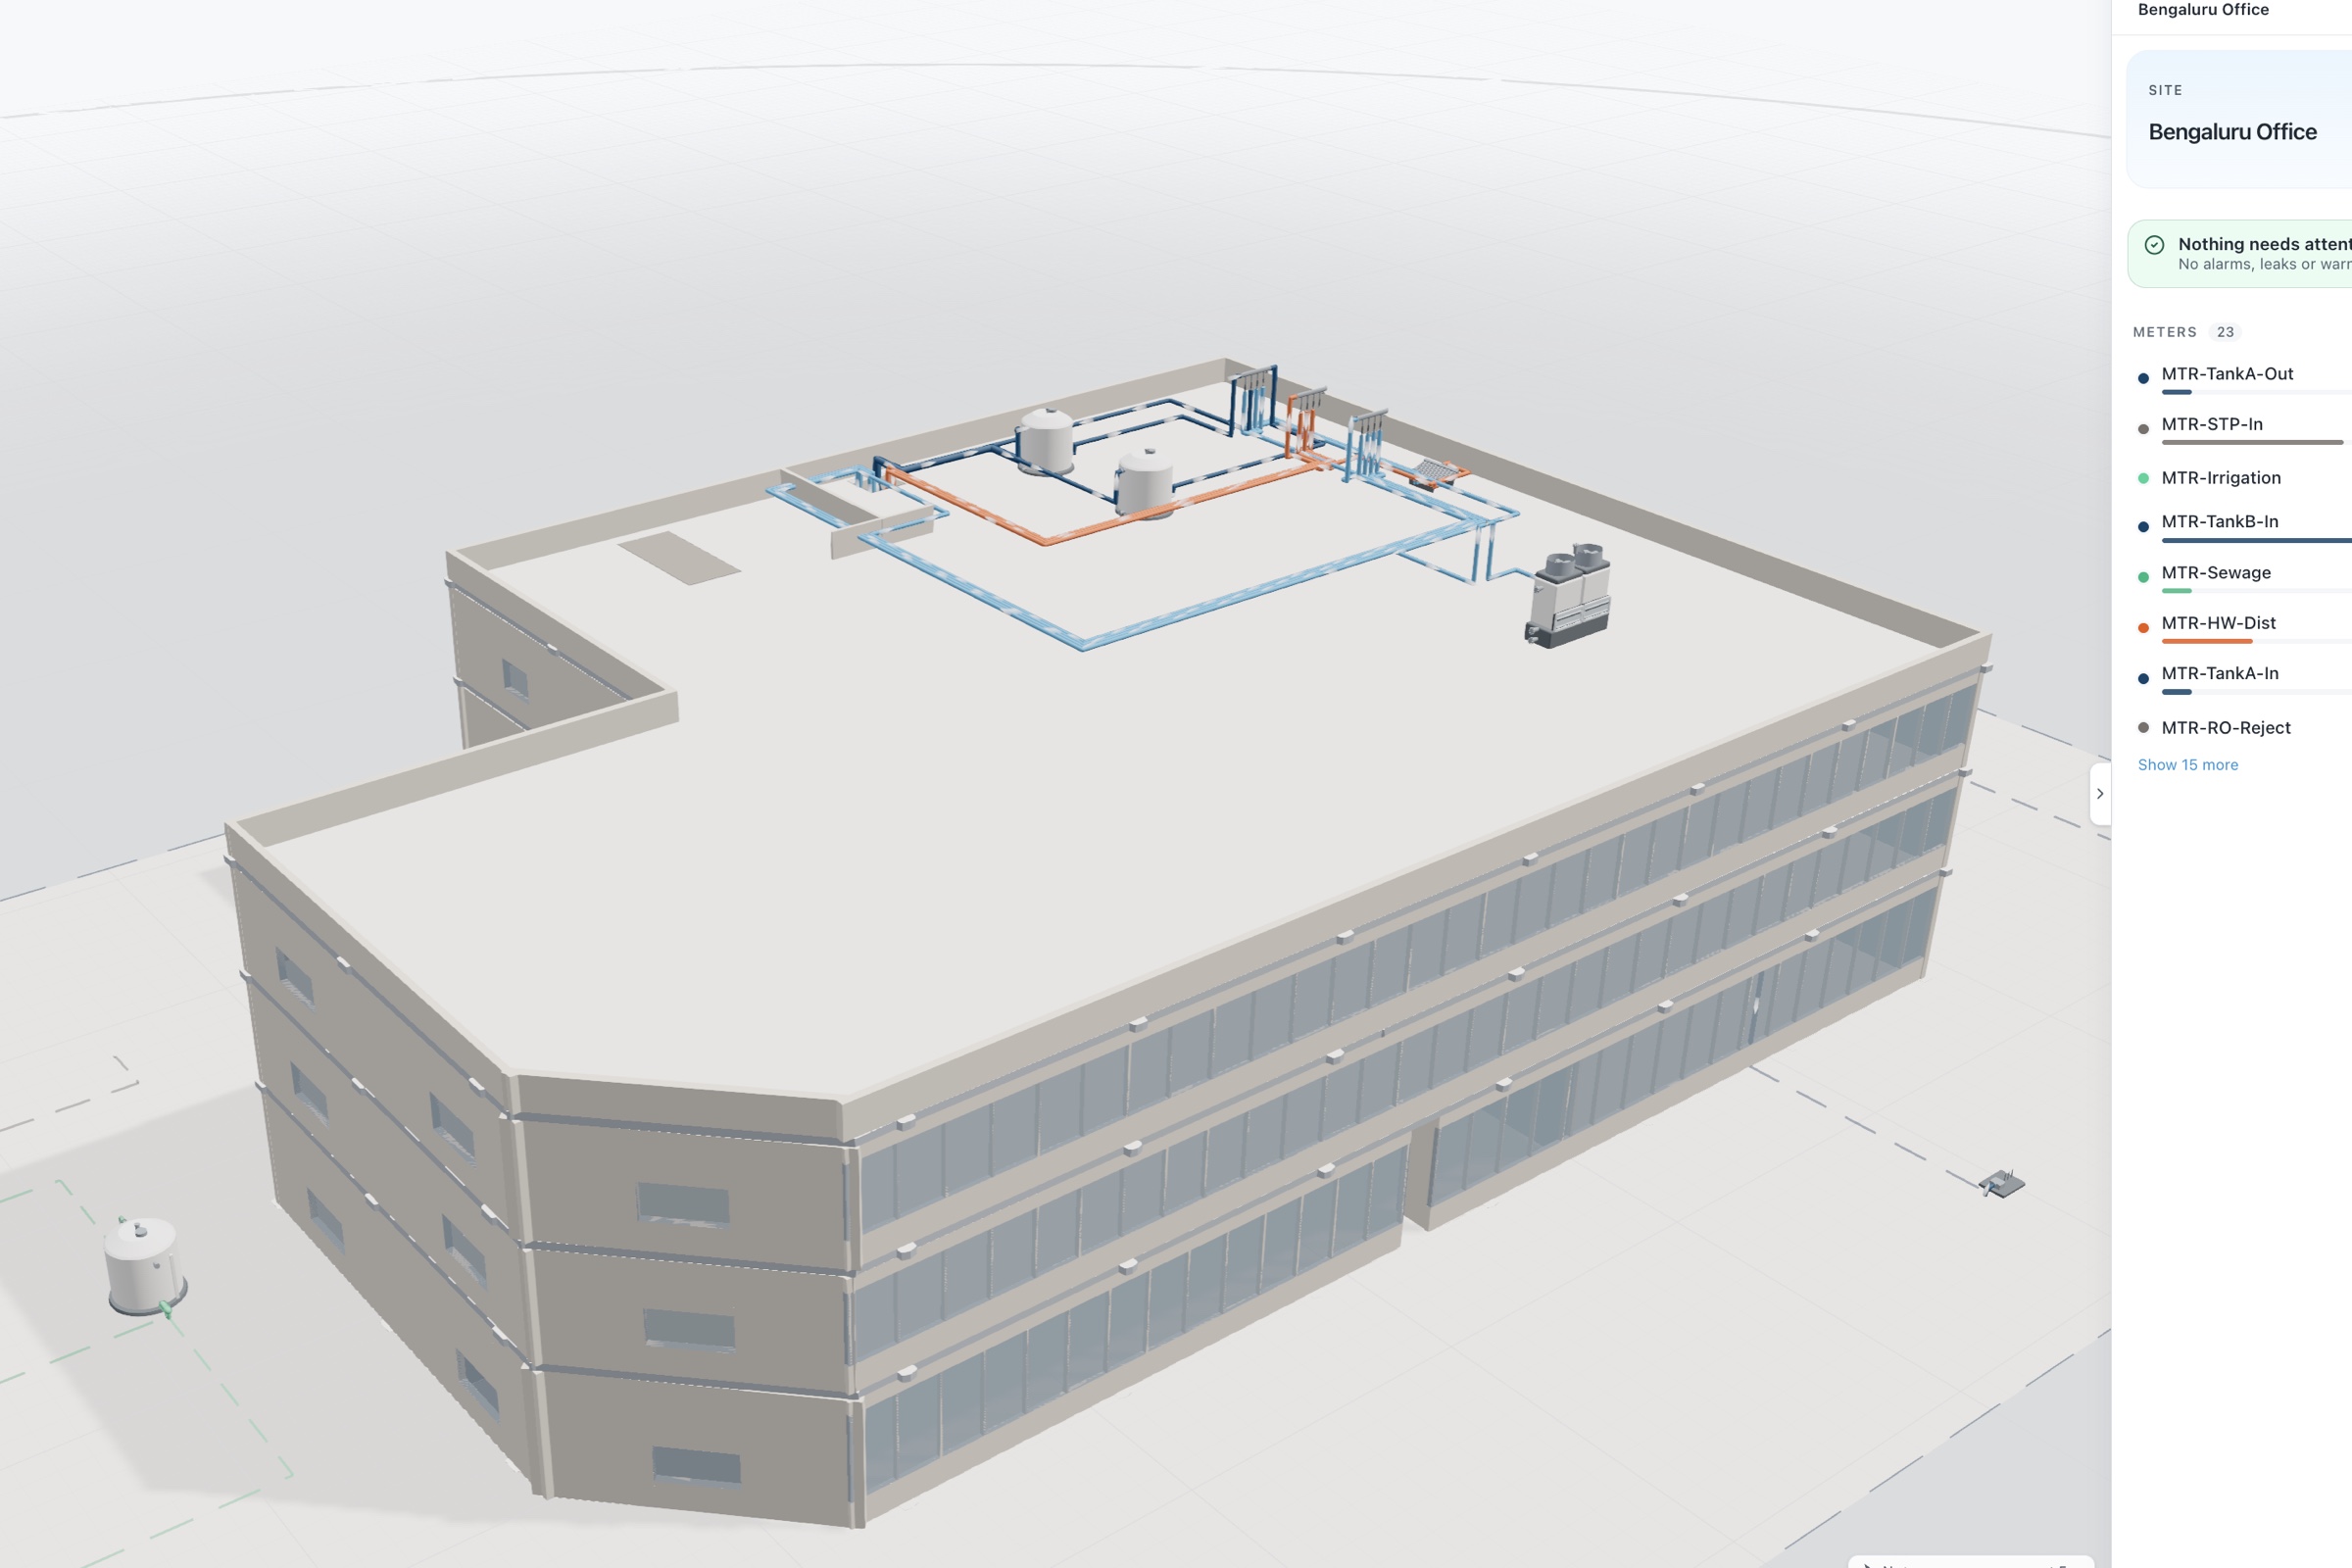
Aqueduct is a facility intelligence platform running across 275+ sites in 21 countries. aQ Core holds every site, floor, zone and device and stores every reading. aQ EnergySmart adds portfolio performance against expected baselines, an electrical digital twin with an energy balance from grid, solar and generator supply to each feeder, power factor and loading, and rate configuration that turns the delta into money. aQ Assistant answers plain-language questions about any site.
Customers keep, replace or build in. Where control is enabled, with owner approval, Smart Controls acts through LoRaWAN relay switches or BACnet and Modbus field devices, with occupancy-driven automations, lockouts and command history. aQ WaterGuard and aQ AirSafe run on the same data layer, so energy, water and air are managed together.
A sensible first step is a short pilot on two or three representative sites. Bills go in for day-one baselines, the BMS is read, gaps are metered, and the team agrees one or two outcomes to judge. Aqueduct then reports actual against expected use, prices the difference and shows the evidence behind every finding, so the decision to scale rests on measured results.