The best energy management system for universities and campuses
 Milvian AI teamFacilities and infrastructure intelligence

The best energy management system for universities models the campus building by building, baselines each one against weather and the academic calendar, separates central plant from building load, finds waste in labs, residence halls and empty classrooms, reads every BMS on campus, supports student and staff reporting, and verifies savings at the meter in the university's own tariff.
Why universities are a hard case for energy management
A university campus is a small city. It has lecture halls, laboratories with fume hoods, libraries open late, residence halls, sports centers, data rooms and sometimes a hospital, often fed from a central chilled water and heating plant. Buildings were added over many decades, each with its own BMS vendor and controls era.
The calendar is unlike any office. Terms, exams, vacations and summer schools change occupancy sharply, and many buildings run full schedules through quiet weeks because nobody changed them. Labs are the hardest case: high air change rates for safety, long hours and expensive conditioned air.
Energy decisions are also shared. Facilities, finance, sustainability offices, academic departments and students all have a stake, and a single monthly bill for the whole campus satisfies none of them.
Many universities have also made public climate commitments with dates attached. That raises the stakes for measurement. A campus cannot show progress toward a carbon target from estimates, and it cannot decide which building to retrofit next without knowing how each one performs against its own expected use. The energy system becomes the evidence base for capital planning as much as a tool for the plant room.
What the best energy management system for universities must do
| Requirement | Why it matters on campus | Question to ask a vendor |
|---|---|---|
| Building level baselines | The campus total hides which buildings waste energy. | Can you baseline every building against weather on its own? |
| Academic calendar awareness | Term, exam and vacation weeks have different expected use. | Can schedules and baselines reflect the academic calendar? |
| Central plant allocation | Chilled water and heat from a central plant must be assigned to buildings. | Can you meter and allocate plant output to each building? |
| Lab and fume hood insight | Labs use far more energy per area than classrooms. | Can you show lab airflow and energy alongside occupancy? |
| Mixed BMS estate | Decades of buildings bring many controls vendors. | Which BMS vendors and protocols do you read? |
| Occupancy-aware HVAC | Empty classrooms and quiet weeks are common. | Can HVAC follow measured occupancy where we approve it? |
| Air quality in teaching spaces | Ventilation affects learning and comfort. | Do you show CO2 and occupancy beside AHU energy? |
| Verified, reportable savings | Climate commitments need evidence. | Is every saving traced to a meter and priced in our tariff? |
The categories campus teams compare
- Traditional BMSEach building's controls are run well by its own BMS. Few give a fair cross-campus comparison or verified savings.
- Standalone EMS dashboardsPopular for campus energy displays and meter trends. Many stop before diagnostics or occupancy-aware control.
- IoT monitoring platformsEasy to add occupancy and air sensors to classrooms. Often separate from plant and metering data.
- CMMS and EAMRun work orders and asset records across the estate. They do not measure the energy cost of a fault.
- Consultants and auditsValuable for master plans and retro-commissioning. Results age as buildings and timetables change.
- Facility intelligence platformsEvery building, the central plant, air quality and verification on one model, reading each BMS rather than replacing it.
How to evaluate an energy management system for a campus
- Inventory buildings, meters and BMSList each building, its meters, its BMS vendor and how it is fed from the central plant. Pull 12 months of bills.
- Load the academic calendarGive vendors term dates, exam weeks and vacations so baselines reflect how the campus is used.
- Pick a mixed pilotChoose a lab building, a teaching building and a residence hall, each with a different BMS.
- Fill gaps and run a termAdd submeters and air sensors where needed and run through at least one change in the calendar.
- Judge on verified resultsCompare each building against its baseline and check the money figure in your tariff.
Evaluation scorecard for campus energy management
| Criterion | Weight | What good looks like |
|---|---|---|
| Building baselines | High | Every building weather-normalized and ranked |
| Calendar awareness | High | Expected use reflects term, exam and vacation weeks |
| BMS coverage | High | Reads every vendor on campus over BACnet and Modbus |
| Plant allocation | Medium | Central plant output metered and assigned to buildings |
| Lab insight | Medium | Lab airflow and energy beside occupancy |
| Air quality | Medium | CO2 and occupancy in teaching spaces |
| Verification | Medium | Savings priced in your tariff and traced to a meter |
| Engagement | Low | Clear building level views for students and staff |
Integration and data on a campus
Keep each building's BMS. The energy system reads them over BACnet and Modbus and puts every building on one model, so a 1960s lecture block and a new science building are compared on the same terms. Add BTU meters where central plant chilled water and heating are not allocated, and clamp-on electrical meters where buildings share a supply.
LoRaWAN sensors suit campuses well: long range, long battery life and no new cable through occupied teaching spaces. Findings route into the estates CMMS so each one has an owner.
Central plant data deserves particular care. If chilled water and heating are not metered into each building, plant energy is either ignored at building level or spread by floor area, which makes efficient buildings look worse and poor ones look better. BTU metering at the building entry fixes that, and lets the campus judge both the plant and the buildings it serves on fair terms.
Compliance and reporting for universities
Universities report energy and carbon to boards, governments and rankings. ENERGY STAR Portfolio Manager is common in North America, ISO 50001 structures an energy program, and many campuses pursue LEED, BREEAM or WELL for new buildings and run building performance standards in their cities. Indoor air quality in teaching spaces is increasingly reviewed against ASHRAE 62.1.
The energy system supplies measured evidence per building. The university, its auditors and certifying bodies make the judgments.
Where Aqueduct fits
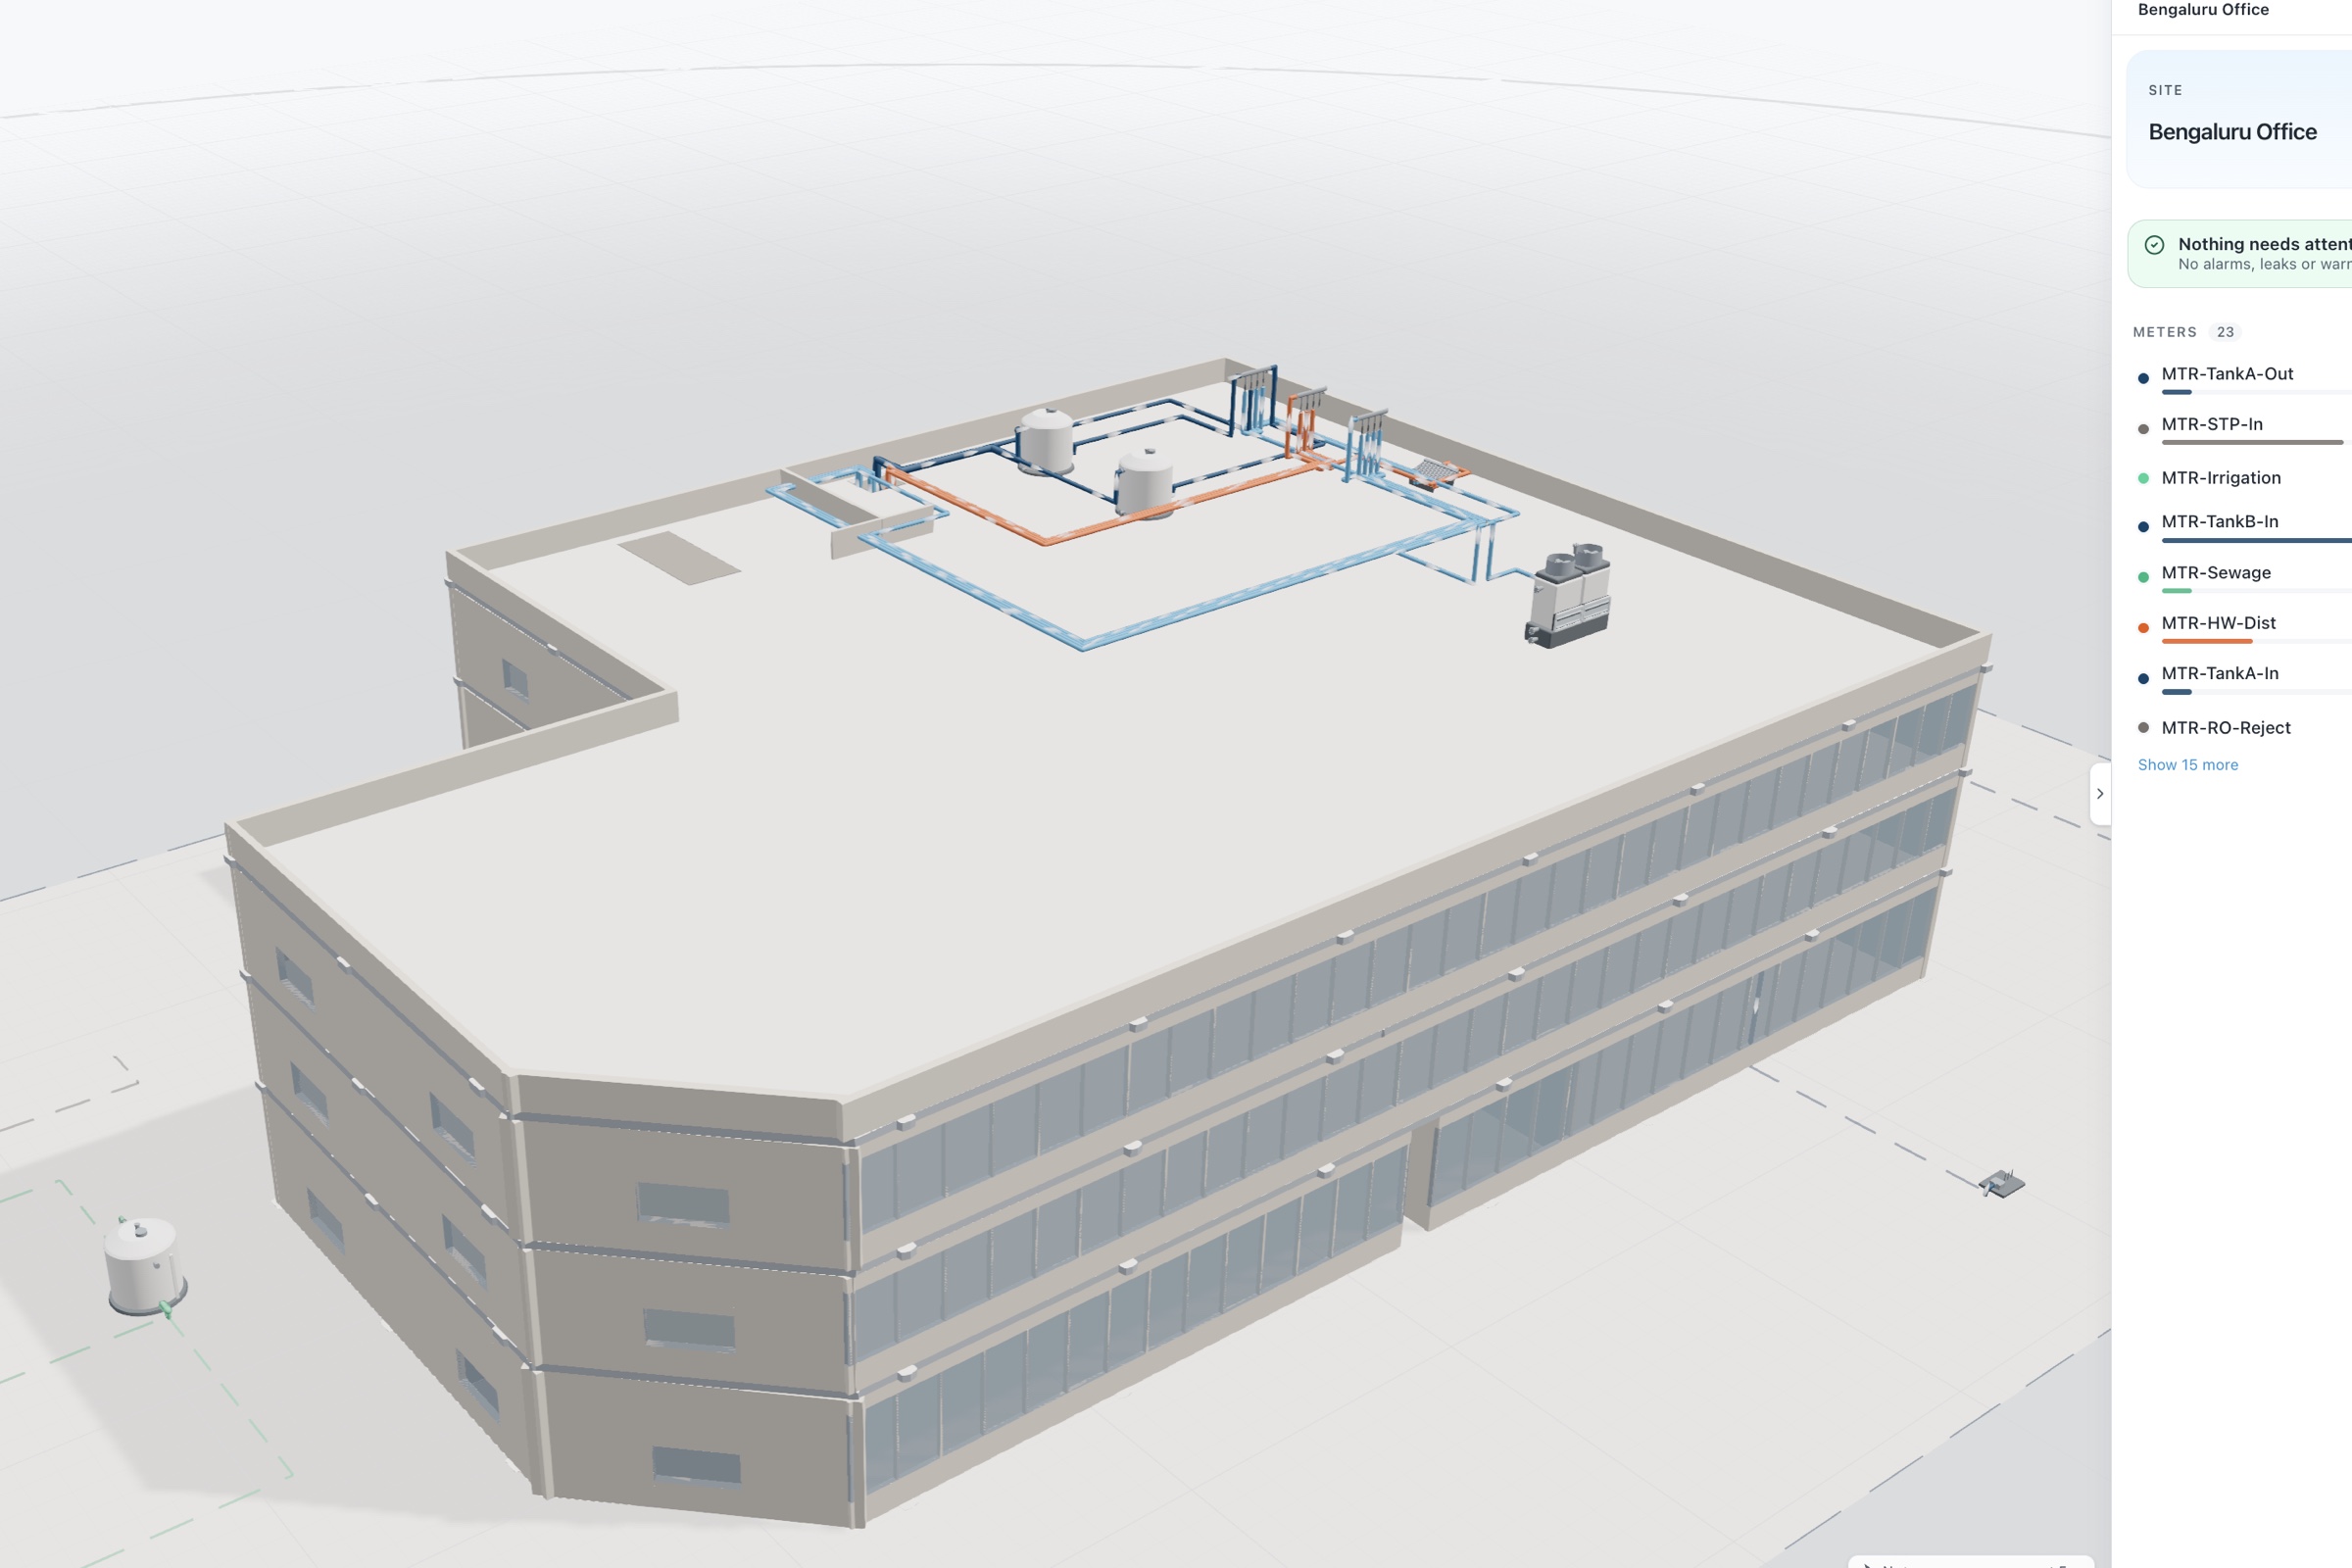
aQ Core models the campus as sites, buildings, floors, zones and devices. aQ EnergySmart baselines every building against cooling and heating degree days, with an electrical digital twin per building and day-one baselines from uploaded bills. aQ AirSafe adds CO2, occupancy and comfort in classrooms, libraries and residence halls, so ventilation and energy are seen together.
Campuses keep their BMS, replace failed meters, or build measurement into new buildings. Where control is enabled, with owner approval, Smart Controls schedules AHUs and RTUs to measured or scheduled occupancy through BACnet or Modbus field devices, with every command logged.
A first engagement usually covers three buildings with different uses and BMS vendors, often a lab, a teaching block and a residence hall. Bills are uploaded, each BMS is read, BTU meters allocate central plant output, and the calendar is loaded. After one change of term, each building's result against its baseline shows where the campus program should go next.