The best energy management system for stadiums, and how to choose one
 Milvian AI teamFacilities and infrastructure intelligence
The best energy management system for stadiums baselines each kind of day separately (match, concert, grounds and dark days), meters floodlights, HVAC, catering and pitch plant at the feeder, manages the demand peak around gate opening, flags idle load on dark days, reads the existing BMS, and verifies every saving at the meter in money, not estimates.
Why stadiums are a hard case for energy management
A stadium does not have one load profile. It has several. On a match day floodlights, video boards, concourse cooling, catering kitchens, hospitality suites and broadcast feeds all ramp up within a few hours of each other. On a dark day the same building should be almost asleep. On a grounds day the pitch plant, irrigation pumps and grow lights run with no crowd at all. A concert moves a stage onto the pitch and shifts where heat and people build up.
Most energy tools assume a building that repeats every week. A venue does not, so a single baseline makes match days look like waste and dark days look like success. The bill makes it worse: one uncoordinated start before gates open can set a demand peak that is charged for months, and idle load on empty days hides inside an invoice nobody reads line by line.
The venue team also has very little time. Plant has to be ready before gates open, and nobody wants a new system that adds risk on the one afternoon that matters most.
What the best energy management system for stadiums must do
| Requirement | Why it matters in stadiums | Question to ask a vendor |
|---|---|---|
| Baselines by day type | Match, concert, grounds and dark days each need their own expected use, or every comparison is wrong. | Can I load the fixture list and get a separate baseline for each kind of day? |
| Weather normalization | Cooling and heating load swing with the season and the kick-off time. | Do you regress on cooling and heating degree days for the venue's own location? |
| Feeder level metering | Floodlights, HVAC, catering and pitch plant need to be separated to find the waste. | Can you show load by feeder and by major plant, not just the main incomer? |
| Demand peak management | A single bad start-up sequence can set the billed peak for a long period. | How do you warn about or sequence loads before gates open? |
| Dark day idle load | Anything running at 3am on an empty day is running for a reason nobody chose. | Will you flag overnight base load against what that day type should draw? |
| Reads the existing BMS | Most venues already have a BMS and do not want to rip it out. | Which protocols do you read, and is the connection read-only by default? |
| Verified savings in money | Boards and operators want results in currency, checked at the meter. | How do you turn the delta against baseline into money using our tariff? |
| Control with guardrails | Pre-cooling and AHU schedules save energy only if they never put an event at risk. | Is every command logged, and can control be limited to equipment we approve? |
The tools venue teams usually compare
- Traditional BMS from a controls manufacturerStrong at running AHUs, chillers and schedules day to day. It usually stops at control points: it rarely baselines by day type, prices waste in money or compares venues.
- Standalone EMS dashboardsGood at showing meter data and monthly trends. Many stop at charts, without weather normalization, fault diagnosis or a way to act on what they find.
- IoT monitoring platformsQuick to fit wireless sensors and alerts. Often thin on the physics behind the numbers, so a floodlight spike and a chiller fault look like the same red line.
- CMMS and EAM systemsThe right home for work orders, assets and technicians. They record what was fixed, not how much energy a fault wasted or whether the fix worked.
- Bill management services and consultantsUseful for tariff reviews and one-off audits. The findings arrive weeks later and are hard to keep current through a season.
- Facility intelligence platformsCombine metering, baselines, diagnostics, verification and approved control on one data layer. The trade-off is that they need a proper instrumentation plan up front.
How to evaluate an energy management system for a stadium
- Walk the venue and pull the billsMap plant rooms, floodlight feeders, catering, the pitch plant and the solar or generator supply. Pull at least 12 months of utility bills and the fixture list for the same period.
- Agree the day typesDecide which kinds of day matter, usually match, concert, grounds, dark and off season, so every vendor is judged on the same terms.
- Ask for a baseline from your own billsA serious vendor can build a weather-normalized baseline from historical bills on day one, rather than asking you to wait a season.
- Pilot between fixturesFit metering on non-event days, read the BMS, and run through at least a few events of each type before judging anything.
- Judge on measured resultsCompare actual against baseline per day type, check the money figure against your tariff, and confirm every finding traces to a meter.
Evaluation scorecard for stadium energy management
| Criterion | Weight | What good looks like |
|---|---|---|
| Day type baselining | High | Separate expected use for match, concert, grounds and dark days |
| Measurement depth | High | Floodlights, HVAC, catering and pitch plant metered at the feeder |
| Demand management | High | Peak forecast and sequencing advice before gates open |
| Savings verification | High | Weather-normalized, priced in your tariff, traced to a meter |
| BMS integration | Medium | Reads BACnet and Modbus, keeps the BMS in place |
| Control and audit | Medium | Command history, lockouts, owner approved scope |
| Portfolio view | Medium | Venues ranked by intensity on the same method |
| Fit-out disruption | Low | Installed on non-event days with clamp-on or wireless sensors |
Integration and data: keep the BMS, fill the gaps
Most stadiums should keep their BMS. It already runs the AHUs, chillers and schedules. The energy system should read it over BACnet or Modbus, add metering where the BMS is blind, and put both on one model of the venue.
The usual gaps are floodlight and catering feeders, the pitch plant, tenant or concession supplies and the split between grid, solar and generator. Clamp-on current sensors and LoRaWAN devices close them without new cable routes through the bowl. Findings should route into the CMMS the venue already uses, so a fault becomes a work order with the evidence attached rather than another inbox.
Compliance and reporting for venues
Venue reporting has grown quickly. Sustainability teams need per event energy figures for sponsors, leagues and green building programs such as LEED, and owners in some cities face building performance standards with real penalties. Investors and operator groups increasingly ask for GRESB or ENERGY STAR Portfolio Manager data.
None of these is satisfied by an estimate. The energy system should export measured, weather-normalized figures per venue and per event, with a clear method. The owner, auditor or program body still does the certifying.
Where Aqueduct fits
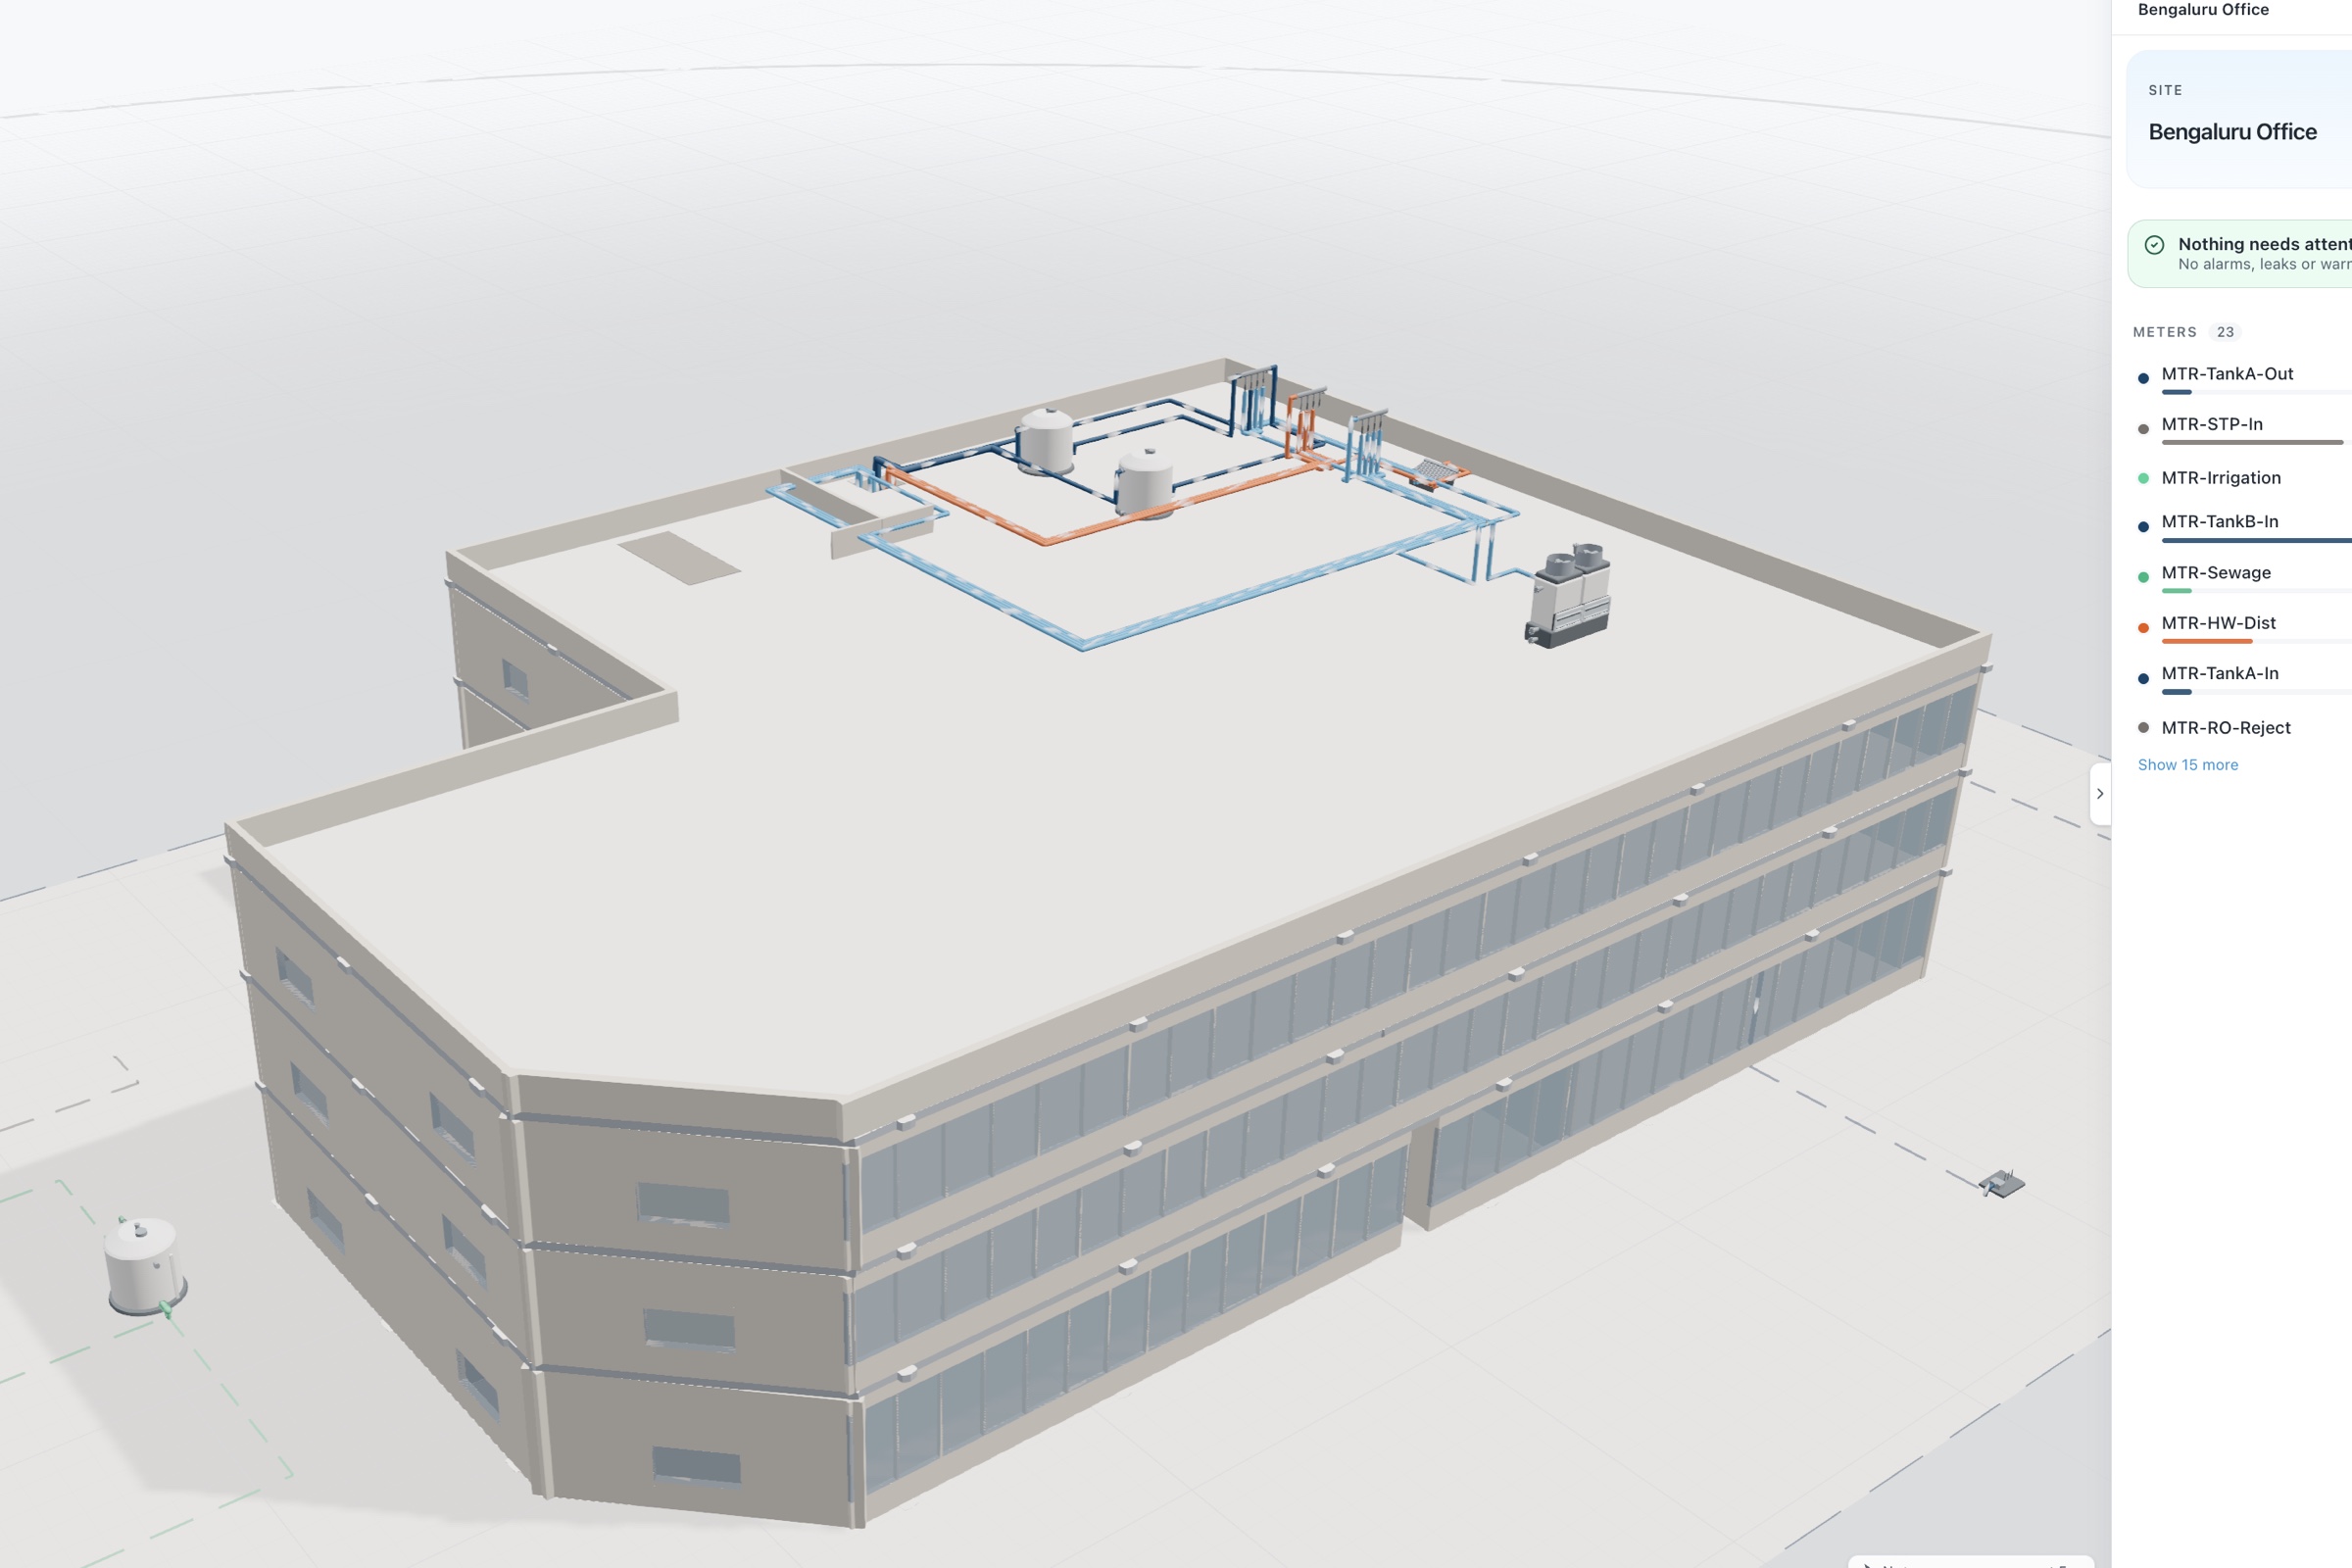
Aqueduct is a facility intelligence platform. aQ Core maps the venue as sites, floors, zones and devices and stores every reading. aQ EnergySmart adds the electrical digital twin, from the incomer and solar or generator supply down to each feeder, and builds baselines by regression on use plus cooling and heating degree days. Upload 6 to 12 months of bills and the baseline is ready on the first day, with rate configuration turning the difference into money.
Venues can keep their BMS and have Aqueduct read it, replace failed meters, or build the measurement layer into a new stand. Where control is enabled, with owner approval, Smart Controls can schedule AHUs, pre-cooling and pumps through BACnet or Modbus field devices or LoRaWAN relays, with every command logged. The same method runs across 275+ sites in 21 countries.