What the best energy management system for manufacturing does on the plant floor
 Milvian AI teamFacilities and infrastructure intelligence

The best energy management system for manufacturing meters utilities and lines separately, ties energy to production so intensity per unit is visible, catches compressed air, steam and refrigeration losses, manages demand peaks and power factor, reads SCADA and PLC data without interfering, routes faults to maintenance and verifies savings at the meter against a weather and production adjusted baseline.
Why manufacturing is a hard case for energy management
A factory's energy follows production, not the calendar. Shifts, changeovers, product mix and maintenance shutdowns move the load far more than weather does. A plant can use more energy in a good month simply because it made more product, so the monthly bill says almost nothing about efficiency.
The utilities that serve production are where waste hides: compressed air leaking at fittings and actuators, steam traps failing open, refrigeration running at the wrong suction pressure, cooling towers cycling too much water, and motors idling between batches. On the electrical side, demand peaks and poor power factor are billed weeks after the shift that caused them.
Plant teams also guard their control systems closely. Any energy tool that touches a PLC or SCADA without permission will not get past the first meeting, and it should not.
What the best energy management system for manufacturing must do
| Requirement | Why it matters in manufacturing | Question to ask a vendor |
|---|---|---|
| Line and utility submetering | The main incomer cannot separate a leaking compressor from a busy line. | Can you meter each line and each utility, including compressed air and steam? |
| Production-normalized intensity | Energy per unit is the only fair efficiency measure. | Can you bring in production counts and show energy per unit? |
| Demand and power factor | Peaks and reactive power penalties are set by a few minutes of operation. | Do you show demand, power factor and loading per feeder in real time? |
| Utility loss detection | Compressed air, steam and refrigeration losses run all day and all night. | How do you find air leaks, failed traps and refrigeration drift from data? |
| Non-intrusive integration | PLCs and SCADA run production and must not be disturbed. | Is your connection to SCADA read-only, and who approves any write? |
| Maintenance routing | A finding without an owner never gets fixed. | Do faults become CMMS work orders with evidence attached? |
| Predictive signals | Vibration and acoustic data warn before a motor or pump fails. | Can you add vibration and acoustic sensors to the same model? |
| Verified savings | Capital teams want results they can defend. | Is each saving measured against a baseline adjusted for weather and production? |
The categories plant teams compare
- SCADA, PLCs and historiansThe backbone of production control and data. They record process values well, but are rarely set up to baseline utility energy or price waste.
- Traditional BMSCovers HVAC in offices and warehouses. It usually sees little of the process utilities on the plant floor.
- Standalone EMS dashboardsGood at meter trends and reports. Many cannot normalize for production or diagnose a utility fault.
- IoT monitoring platformsQuick to add sensors and alerts to old machines. Often light on electrical depth such as power factor and feeder loading.
- CMMS and EAMRun maintenance and spares. They track what was repaired, not the energy lost before the repair.
- Facility intelligence platformsUtilities, electrical depth, predictive signals and verified savings in one model, reading SCADA rather than replacing it.
How to evaluate an energy management system for a plant
- Walk the utilitiesMap transformers, main panels, compressors, boilers, refrigeration, cooling towers and the largest motors. Pull 12 months of bills and production data.
- Set the intensity metricAgree the unit that matters, energy per tonne, per batch or per unit, so every vendor reports the same thing.
- Ask for a baseline from historyHave each vendor build a baseline from bills and production records before any sensor goes in.
- Pilot one utility end to endCompressed air or refrigeration is a good start. Meter it, find the losses, fix them and measure the result.
- Judge on verified intensityDid energy per unit fall against the adjusted baseline, and is the money figure right for your tariff?
Evaluation scorecard for manufacturing energy management
| Criterion | Weight | What good looks like |
|---|---|---|
| Utility depth | High | Compressed air, steam, refrigeration and towers metered and baselined |
| Electrical depth | High | Demand, power factor and feeder loading in real time |
| Production normalization | High | Energy per unit with production counts in the model |
| Safe integration | High | Read-only SCADA and PLC connection unless approved otherwise |
| Savings verification | Medium | Measured against an adjusted baseline, priced in your tariff |
| Predictive maintenance | Medium | Vibration and acoustic signals on critical motors and pumps |
| Maintenance workflow | Medium | Findings routed to the CMMS |
| Multi-plant view | Low | Plants ranked on intensity using one method |
Integration and data in a plant
Keep SCADA, PLCs and the historian. The energy system reads them over Modbus, BACnet or the historian's interface, read-only by default, and adds what they lack: feeder level power quality, compressed air flow, steam and condensate, refrigeration plant power and cooling tower make-up.
Clamp-on current sensors and LoRaWAN devices go in while lines run. Anything that needs a line break waits for a planned shutdown. Findings route to the CMMS the maintenance team already uses.
Data quality is worth asking about early. Plants are electrically noisy, gateways sit behind steel and concrete, and a meter that drops out during a night shift can make a loss look like a saving. The system should show connection rate and device health per sensor, and flag periods with poor coverage before anyone draws a conclusion from them. Ask too how production counts arrive, whether from the MES, the historian or a daily upload.
Compliance and reporting in manufacturing
ISO 50001 is the common structure for an industrial energy management system: a baseline, performance indicators and evidence of improvement. Corporate climate reporting, including CSRD in Europe and customer supply chain requests, needs measured scope 1 and 2 figures per site.
A good energy system supplies the baseline, the indicators and the metered evidence. Certification and assurance stay with the certification body and the auditor.
Where Aqueduct fits
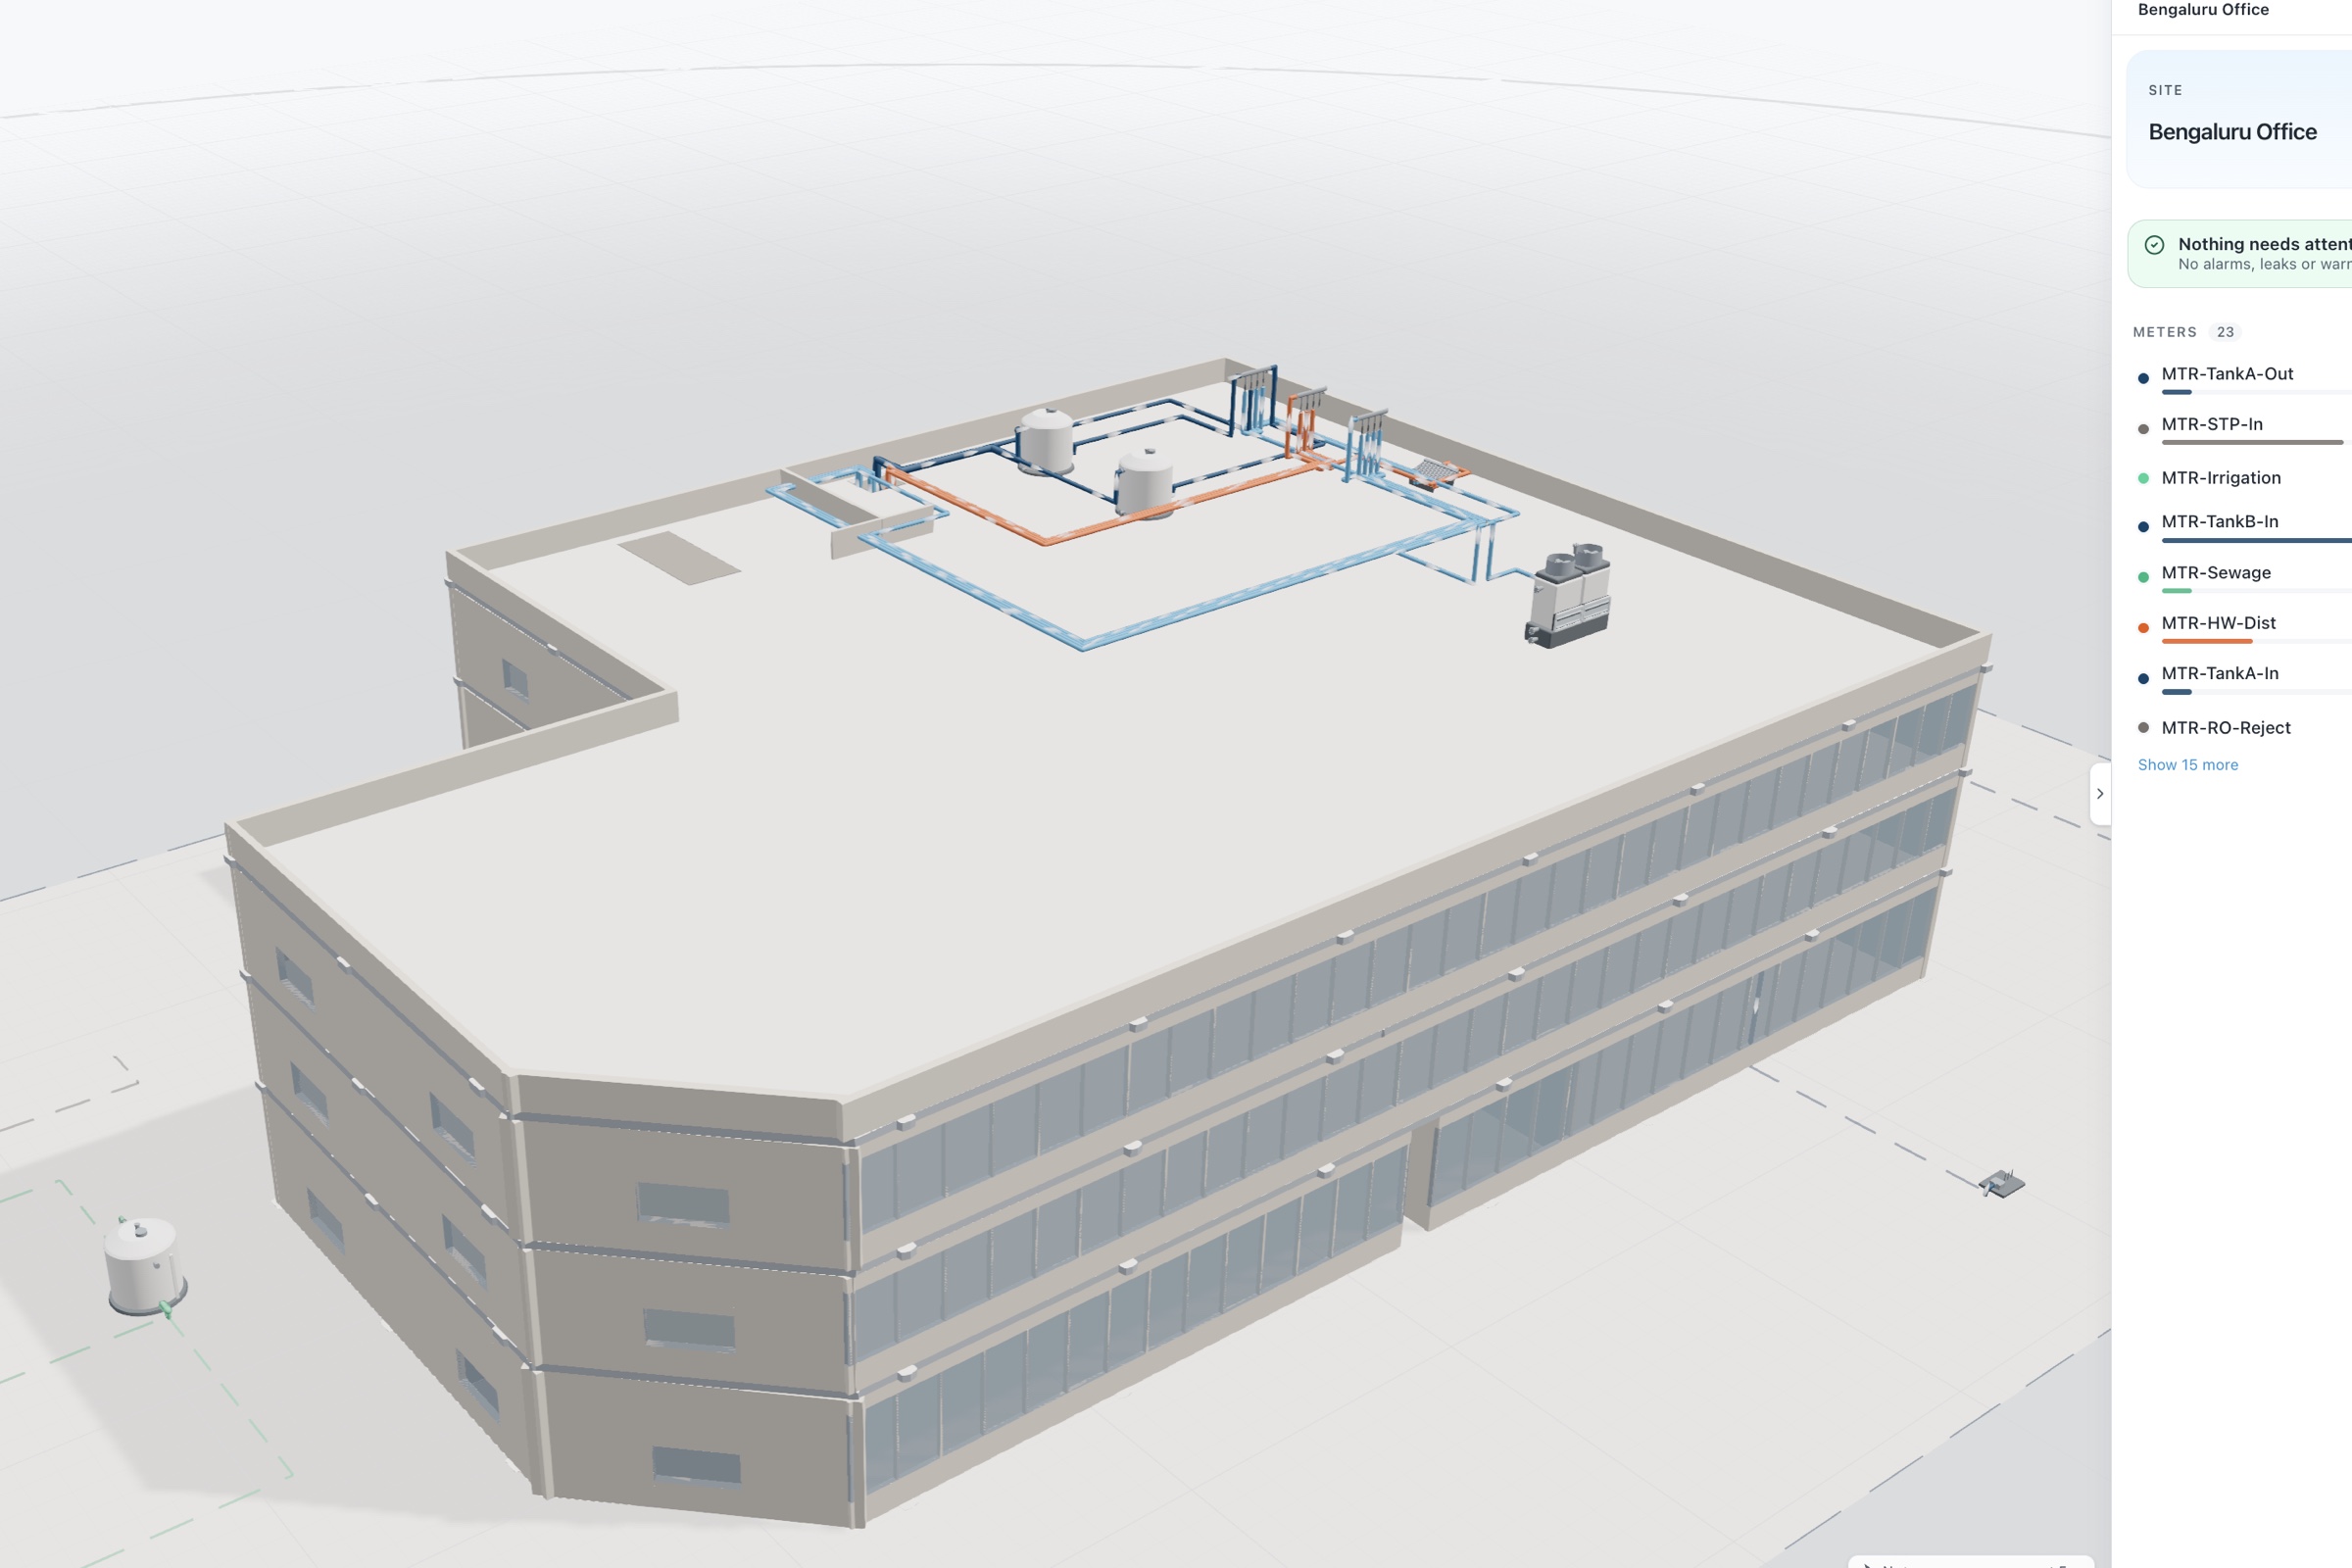
Aqueduct runs on a 300-acre FMCG manufacturing campus, among 275+ sites in 21 countries. aQ Core maps the plant as sites, zones and devices. aQ EnergySmart builds the electrical digital twin, with an energy balance from grid, solar and generator supply to each feeder, power factor and loading per feeder, and baselines that turn the difference into money through rate configuration. aQ PredictIQ adds vibration and acoustic signals on critical rotating plant.
Plants keep SCADA and the CMMS. Where control is enabled, with owner approval, Smart Controls can sequence non-process loads such as HVAC, exhaust and lighting through BACnet or Modbus field devices or LoRaWAN relays, with lockouts that prevent short cycling and a full command history.
A first engagement usually focuses on one utility, often compressed air or refrigeration, on one plant. The utilities are walked, bills and production data are uploaded, and metering goes in while lines run. The first losses are named in kWh and money against the adjusted baseline, fixed by the plant team and verified, before the model extends to further utilities, lines and plants.