The best building management system for manufacturing plants: utilities, not just office HVAC
 Milvian AI teamFacilities and infrastructure intelligence
The best building management system for manufacturing plants looks past office HVAC to the utilities production runs on: compressed air, process cooling, boilers and steam, water treatment and effluent. It meters each line and utility, reads SCADA and PLCs without disturbing them, manages peak demand and power factor, predicts equipment failures and acts only where control is enabled, with owner approval.
Why manufacturing plants are a hard case for a BMS
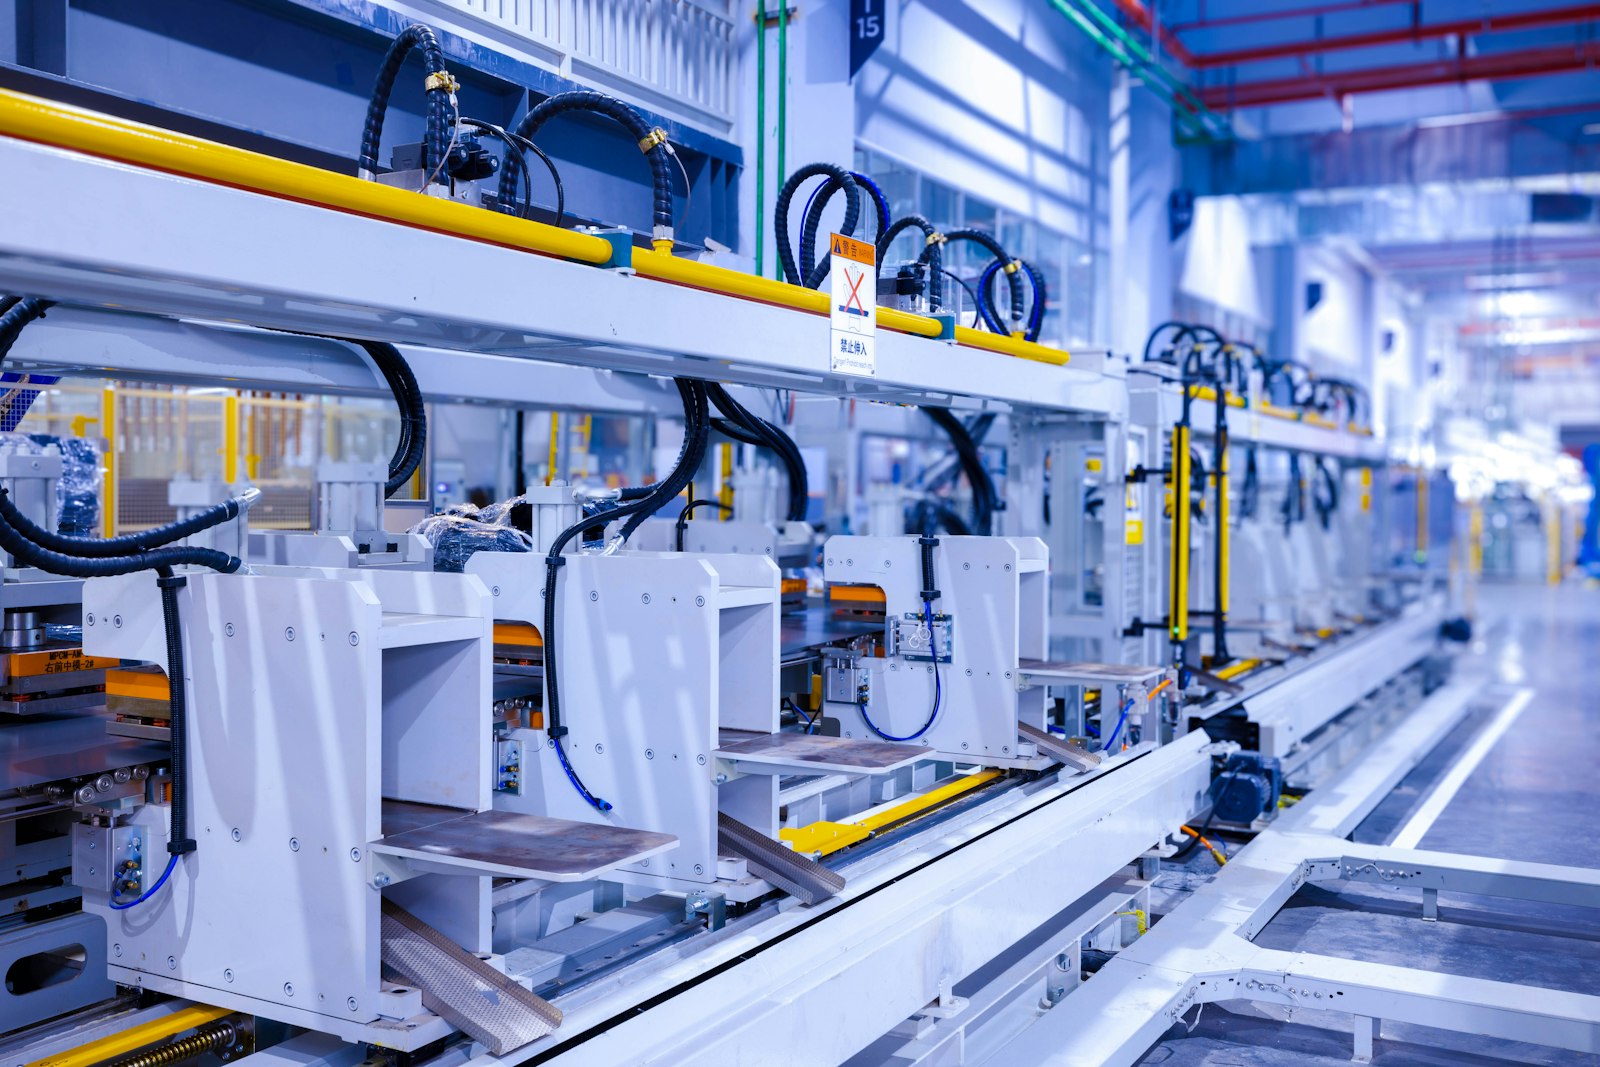
In most plants, the BMS runs the offices, canteen and perhaps warehouse ventilation. Production runs on something else entirely: PLCs and SCADA controlling lines, and a utility backbone of compressed air, chilled water, process cooling towers, boilers and steam, nitrogen or other gases, water treatment and effluent plants. That backbone is where most of the energy and water goes, and it is the part the BMS cannot see.
Utilities are often run as a cost center with little measurement below the main incomer. Compressed air leaks hiss through every shift. Steam traps fail open and condensate goes to drain. RO plants reject more water than they should and effluent treatment runs below its design efficiency. Each of these is invisible on the monthly bill, which only shows that the site used a lot.
Power adds its own problems. Large motors, compressors and furnaces create demand peaks and reactive load. Many sites in India and other markets run on grid, rooftop solar and diesel generation together, and the choice of source changes cost by the hour. Shift patterns, changeovers and maintenance shutdowns mean the plant's normal is not a fixed weekly schedule.
Plant teams are also measured on output first. Utilities get attention when they fail, not when they waste. A system that shows the cost of a compressed air leak or a failed steam trap in money per shift, next to the evidence, gives the utilities team a case they can take to production management.
What the best BMS for manufacturing plants must do
| Requirement | Why it matters in manufacturing | Question to ask a vendor |
|---|---|---|
| Meter utilities by line and system | Production cost depends on which line used what | Can you meter compressed air, cooling, steam and water per line |
| Read SCADA and PLCs without interference | Production control is off limits | How do you read our SCADA and PLC data read-only |
| Energy balance across sources | Grid, solar and generators change cost by the hour | Can you show grid, solar and backup generation against loads |
| Peak demand and power factor | Demand charges and reactive penalties are avoidable costs | How do you show peaks, power factor and feeder loading |
| Water balance and treatment efficiency | RO, STP and ETP performance drive water cost and compliance | Can you show RO recovery, STP efficiency and unaccounted loss live |
| Predictive maintenance | Unplanned downtime costs more than energy | How do you detect early failure in compressors, pumps and fans |
| Baselines that follow production | Output, shifts and weather all change consumption | Can baselines account for weather and production patterns |
| Governed control outside production | Production cannot be put at risk | Where would you act, and how is every command approved and logged |
The categories of tools plants compare
- Building BMSGood control of office and warehouse HVAC. Does not see process utilities.
- SCADA and MESStrong real-time control and production tracking. Not designed for utility cost analysis or water balance.
- Energy monitoring systemsMeter electricity at panel level, often well. Rarely cover water, steam or compressed air, and rarely act.
- Compressed air and steam auditsExpert surveys find leaks and failed traps. Snapshots that fade between visits.
- CMMS and EAMRun maintenance and spares. Rely on technicians to spot problems.
- Facility intelligence platformsOne data layer across meters, BMS and SCADA reads, with energy and water digital twins, baselines, predictive alerts and governed control outside production.
How to evaluate a plant BMS or platform
- Walk the utility backboneTrace compressed air, steam, cooling and water from source to use and record existing meters and gaps.
- Upload bills and production dataBills plus output and shift patterns give a baseline that separates production from waste.
- Meter the big utilities firstCompressors, boilers, chillers, RO and effluent plants give the fastest results.
- Pilot one utility with a measured resultFor example, compressed air leaks or RO recovery, measured against an agreed baseline.
- Extend line by lineAdd line-level metering so each product's utility cost becomes visible.
Evaluation scorecard for manufacturing plants
| Criterion | Weight | What good looks like |
|---|---|---|
| Utility coverage | High | Electricity, gas, steam, compressed air and water metered |
| Water and treatment visibility | High | Live water balance with RO and STP performance |
| Read-only SCADA integration | High | Production data read without touching control |
| Demand and power quality | Medium | Peaks, power factor and feeder loading by source |
| Predictive maintenance | Medium | Early fault signs routed to the CMMS |
| Control governance | Medium | Owner approval, lockouts and command history outside production |
Integration and data
Plants rarely need a new BMS. They need the utility layer measured. Energy meters and many utility skids speak Modbus, building systems speak BACnet, and SCADA can be read through its historian or a gateway without touching control. LoRaWAN meters and sensors, including vibration and acoustic sensors, reach across large sites without trenching.
The plant's CMMS stays the system of record. Predictive alerts arrive there with the evidence, so maintenance plans around a failing bearing rather than discovering it on the line.
Multi-site manufacturers should design one metering template for similar plants. When every plant meters compressed air, steam and water the same way, the group can compare sites fairly, share fixes that worked and direct capital to the sites with the largest verified gap against their own baseline.
Where diesel generation backs up the grid, meter it like any other source. Generator runtime, fuel and output belong in the same energy balance as grid and solar, so the true cost of each hour of production is visible.
Compliance and reporting in manufacturing
Many manufacturers run ISO 50001 energy management and ISO 14001 environmental management systems, and both need measured data. Water discharge consents and effluent standards set by local regulators depend on treatment plant performance. Corporate disclosure under frameworks such as CSRD increasingly reaches plant-level energy, water and emissions.
A platform supplies continuous, metered evidence for these systems and reports. The manufacturer and its auditors make the determinations.
Where Aqueduct fits
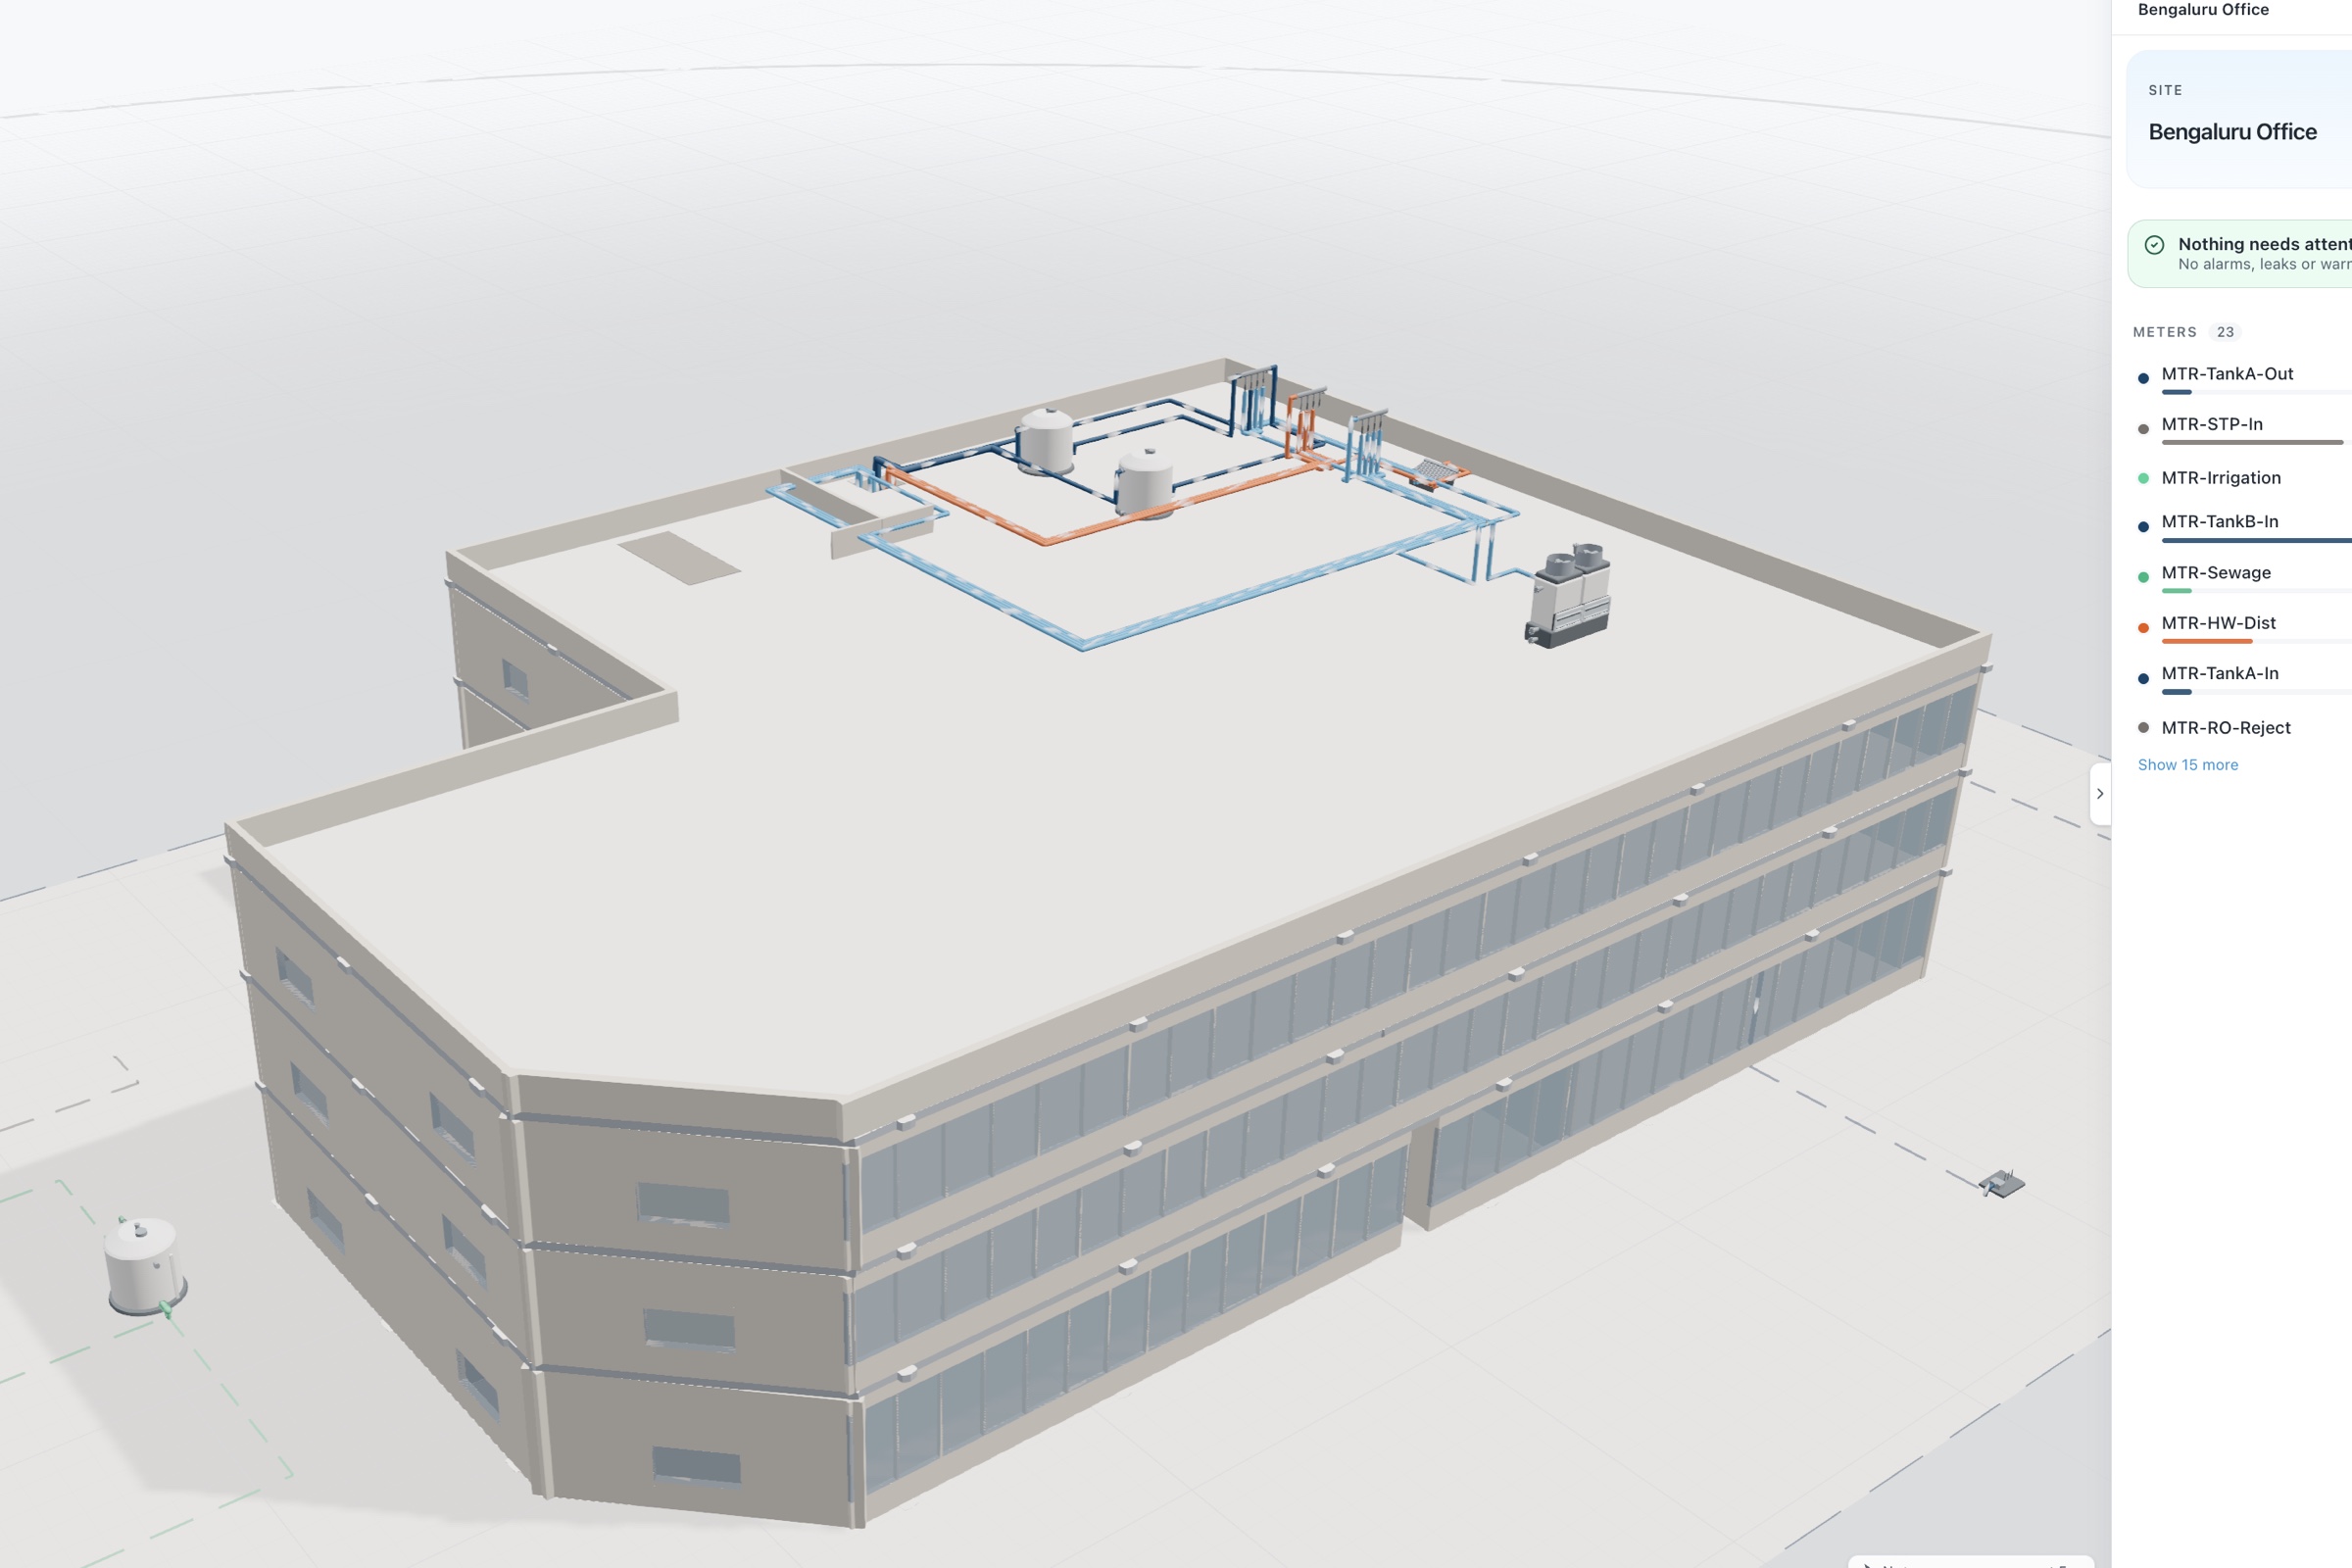
Aqueduct models the plant in aQ Core and reads meters, BMS and SCADA data into one store. aQ EnergySmart provides the electrical digital twin with the energy balance across grid, solar and backup generation, peak demand, power factor and feeder loading. aQ WaterGuard shows the water balance with RO recovery, STP efficiency and unaccounted loss live. Vibration and acoustic sensors add early warning for rotating equipment.
Smart Controls acts outside production, on ventilation, lighting, utilities sequencing and similar loads, through LoRaWAN relays or Modbus and BACnet field devices, where control is enabled, with owner approval, with lockouts and a command history. Aqueduct serves a 300-acre FMCG manufacturing campus and major dairy operations.