The best building management system for data centers: cooling, power and water in one honest view
 Milvian AI teamFacilities and infrastructure intelligence
The best building management system for data centers works alongside DCIM and EPMS rather than competing with them. It meters cooling, power distribution and water at system level, tracks PUE and WUE continuously, finds drift in chillers, CRAHs and towers before it becomes risk, and leaves critical cooling control with the trusted systems unless the owner explicitly approves otherwise.
Why data centers are a hard case for a BMS
A data center is a building whose only job is to keep IT equipment powered and cool. Everything is redundant, everything runs around the clock and the cost of an outage dwarfs the cost of energy. Facility teams are rightly conservative: no one wants a clever optimization to trip a chiller during a load peak.
Data centers usually run several overlapping systems. The BMS controls mechanical plant: chillers, CRAHs or CRACs, pumps, cooling towers and economizers. An electrical power monitoring system watches switchgear, UPS and PDUs. DCIM tracks racks, capacity and assets. Each has its own front end, and none of them is designed to answer the questions owners now face: how efficient is the facility really, how much water does it consume, and is the plant drifting.
Water has become a first-order issue. Evaporative cooling saves energy but consumes water, and communities and regulators increasingly ask how much. A BMS that sees the cooling tower fan but not its make-up and blowdown flows cannot help.
Load is also changing. Higher density racks and liquid cooling are arriving in halls designed for air, and many operators run mixed environments. Plant that was sized for one load profile now serves another, and the efficiency curve it was commissioned on no longer holds. Without continuous measurement, that drift stays invisible until a capacity problem or an energy review exposes it.
Colocation adds a commercial layer. Customers want to know the efficiency and water figures for the space they rent, and contracts increasingly ask for them. Figures assembled once a year from spreadsheets do not stand up to that scrutiny.
What the best BMS for data centers must do
| Requirement | Why it matters in data centers | Question to ask a vendor |
|---|---|---|
| Work with DCIM and EPMS | Each system has a role, and duplication creates confusion | Which data will you read from our BMS, EPMS and DCIM, and what will you add |
| Continuous PUE | Spot PUE figures hide seasonal and load-driven variation | How do you calculate PUE continuously, and from which meters |
| Continuous WUE and water balance | Water use is now scrutinized alongside energy | How do you meter make-up, blowdown and other cooling water |
| Plant efficiency drift | Chillers and towers lose efficiency gradually | How do you baseline plant efficiency and flag drift |
| Power quality and losses | UPS and transformer losses and power factor carry real cost | Can you show losses and power factor by feeder |
| Predictive equipment health | Failures are far more expensive than energy | How do you detect early signs of failure in fans, pumps and compressors |
| Strict control governance | Critical cooling must not be put at risk | Can the platform be read-only, and how is any control approved and logged |
| Evidence for reporting | Operators face growing energy and water disclosure | What exports do you provide for regulators and customers |
The categories of tools data centers compare
- BMS from controls manufacturersReliable mechanical plant control with redundancy. Limited analytics, short histories, little water visibility.
- EPMSDetailed electrical monitoring of switchgear, UPS and PDUs. Not designed for mechanical or water analysis.
- DCIMStrong on racks, capacity, assets and change management. Usually thin on plant performance.
- Standalone PUE dashboardsSimple headline metric. Little help explaining why it moved.
- Consultant energy assessmentsDeep one-time analysis for retrofits. Goes stale without continuous data.
- Facility intelligence platformsOne data layer across BMS, EPMS and water metering, with baselines, digital twins, drift detection and evidence. Works alongside DCIM rather than replacing it.
How to evaluate a data center BMS or platform
- Agree the read-only boundaryStart with read-only integration. Decide later, with operations leadership, whether any non-critical control is wanted.
- Inventory meters and pointsList the IT load meters, plant meters and water meters that exist, and the gaps for PUE and WUE.
- Fill the water gapsMake-up, blowdown and any reclaimed water sources usually need metering.
- Baseline the plantModel plant efficiency against outdoor conditions and IT load, so drift is visible.
- Pilot one hall or plantMeasure what the platform finds against the agreed baseline before rolling out.
Evaluation scorecard for data centers
| Criterion | Weight | What good looks like |
|---|---|---|
| Integration with BMS, EPMS and DCIM | High | Reads all three, adds analysis, duplicates nothing |
| Continuous PUE and WUE | High | Calculated from real meters with gaps flagged |
| Plant drift and equipment health | High | Baselines against conditions and load, early fault signs |
| Water metering | Medium | Make-up, blowdown and reuse balanced |
| Read-only option and governance | Medium | Read-only by default, any control approved and logged |
| Security | High | Clear network design that operations and IT approve |
Integration and data
Data center plant almost always speaks BACnet or Modbus, and electrical monitoring is often Modbus too. That makes a read-only overlay straightforward: a field device network controller reads the points without touching control logic. LoRaWAN meters are useful for retrofitting water metering on cooling systems without disturbing operations.
Keep the BMS, keep the EPMS and keep DCIM. The platform reads them, adds water and long-term analytics, and routes findings into the CMMS with evidence.
The value of the overlay is in joining the data. The BMS knows the chiller is running. The EPMS knows how much power the plant draws. The water meters know what the towers consume. Put together against IT load and outdoor conditions, they show whether the plant is performing as it should, and which component is responsible when it is not.
Compliance and reporting in data centers
PUE and WUE are metrics defined by The Green Grid and are now standard in customer and regulatory reporting. ASHRAE publishes thermal guidelines for data processing environments and ASHRAE Standard 90.4 addresses data center energy. In the European Union, the Energy Efficiency Directive requires data centers above a size threshold to report energy and water performance. ISO 50001 applies to operators running a formal energy management system.
A platform supplies continuous, metered figures for these frameworks. The operator decides what to report and how.
Customers ask too. Colocation and enterprise customers increasingly include energy, water and carbon figures in their procurement and sustainability questionnaires. Answers backed by continuous metering are easier to defend than answers based on design figures.
Where Aqueduct fits
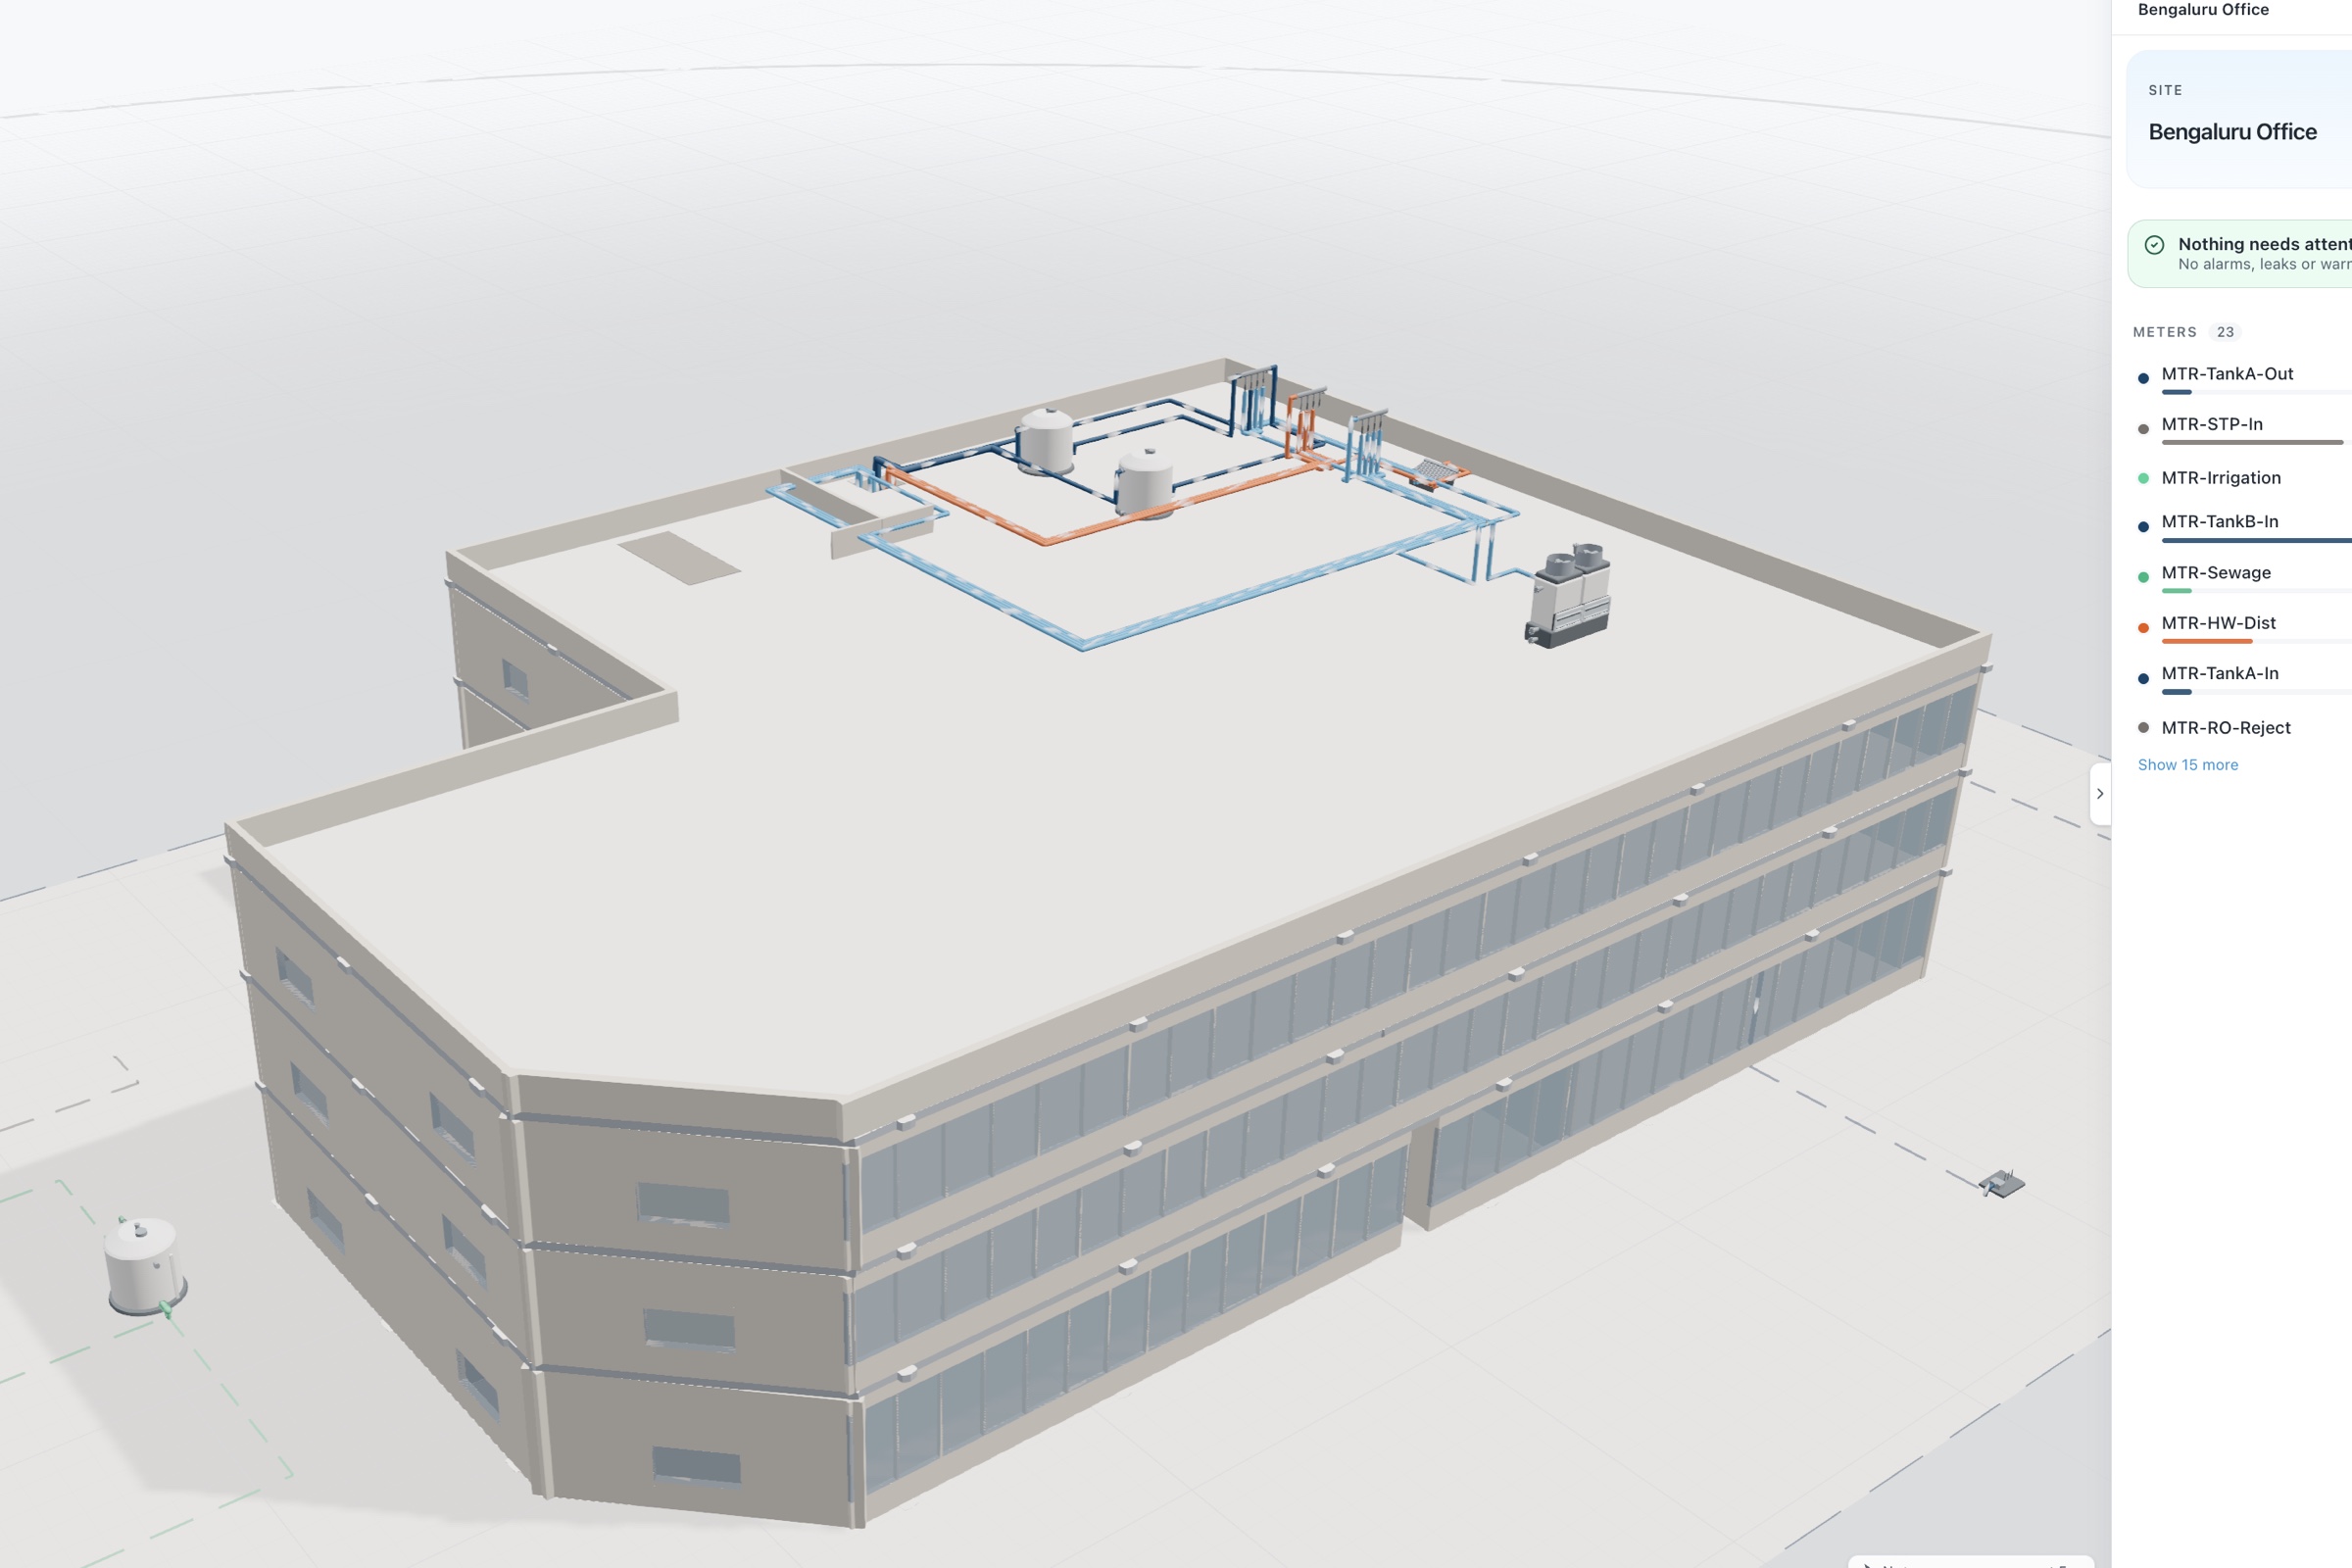
Aqueduct reads the BMS and electrical monitoring into aQ Core, alongside its own meters. aQ EnergySmart provides the electrical digital twin, with losses, power factor and demand by feeder, and weather-normalized baselines for the plant. aQ WaterGuard balances cooling water across make-up, blowdown and any reuse, so WUE comes from meters.
Aqueduct can stay read-only. Where an operator wants Smart Controls on non-critical systems, it acts through Modbus and BACnet field devices, where control is enabled, with owner approval, with lockouts and a command history. Critical cooling stays with the systems you already trust.