The best airport intelligence platform for terminals, plant and airside utilities
 Milvian AI teamFacilities and infrastructure intelligence

The best airport intelligence platform brings terminal HVAC, central plant, water networks, washrooms, baggage halls and airside utilities onto one live data layer. It baselines each system against weather and passenger traffic, balances water across the campus, reads air quality against occupancy, finds faults before they disrupt operations, routes them to the CMMS, and acts on equipment only where control is enabled, with owner approval.
Why an airport is a hard case for facility systems
An airport is a small city that never sleeps. Terminals run around the clock, with wave patterns that follow the flight schedule rather than office hours. Central plant serves terminals, piers, offices and sometimes hotels. Baggage systems, jet bridges, pre-conditioned air and ground power add loads that most buildings never see. Water runs through a campus network with its own mains, tanks, washrooms, kitchens, cooling towers and often treatment and reuse.
Most airports have grown in phases, so systems have grown with them. One terminal has one BMS, an extension has another, the central plant has its own controls and the airside utilities sit with a different team. Meters exist but report to different places. When the energy bill rises or a washroom block floods, it takes days to find out why.
The stakes are operational as well as financial. A chiller failure on a peak travel day affects thousands of passengers. A water main leak under an apron can run for months. A poorly ventilated gate area in a long delay becomes a complaint and a reputational problem. The platform has to make the whole campus visible and keep it running.
What the best airport intelligence platform must do
| Requirement | Why it matters in an airport | Question to ask a vendor |
|---|---|---|
| Cover the whole campus | Terminals, plant, piers and airside utilities share services | Can every building and network sit in one hierarchy? |
| Follow passenger waves | Loads and occupancy follow the flight schedule | Can flight or passenger data shape baselines and alerts? |
| Balance campus water | Leaks in buried mains run for months | Do you reconcile supply against buildings, towers and reuse? |
| Read gate and hall air | Crowded gates in delays are the worst air in the building | Do you read CO2 and occupancy per zone? |
| Show the electrical single line | Large loads, generators and solar change the picture hourly | Can you show grid, generation and feeders live, with power factor? |
| Find faults early | Plant failures on peak days are costly | Do you run fault detection and predictive maintenance on plant? |
| Integrate many systems | Several BMS, SCADA and meters from different eras | How do you read BACnet, Modbus and SCADA without replacing them? |
| Support sustainability reporting | Airports report carbon and water with growing scrutiny | Can every figure trace to a meter? |
The categories of tools airport teams compare
- Traditional BMS and BAS from controls manufacturersReliable, proven control of air handlers, chillers and lighting, with trusted local sequences. Built for control engineers, they rarely cover water, sub-metering or portfolio analytics, and they keep data inside one vendor's world.
- Standalone EMS dashboardsGood at interval energy charts and alarms for one utility. They usually stop at display, without water, air quality, digital twins or a path to control.
- IoT monitoring platformsFast to deploy wireless sensors with tidy charts. Strong for one problem, weaker on balances, baselines, control and the integration that turns a chart into a work order.
- CMMS and EAMThe right home for work orders, assets and maintenance history. They rely on people or other systems to tell them something is wrong.
- Utility bill services and consultantsUseful for audits, bill collection and expert judgment. Monthly and periodic, so they explain what happened long after it happened.
- Facility intelligence platformsOne data layer across water, energy and air, with live digital twins of the systems, weather-normalized baselines, alerts that route to the CMMS and control where control is enabled, with owner approval. For an airport the value is in joining terminals, plant and airside networks in one view.
How to evaluate an airport intelligence platform
- Map systems and ownersList each BMS, SCADA, meter network and the team that owns it. Many airports find three or four control systems in one terminal.
- Gather bills and traffic dataTwelve months of utility bills and passenger numbers support a baseline that separates weather and traffic from waste.
- Walk the plant and the water networkCentral plant, cooling towers, tanks, washroom blocks and the main water routes, marking meters and gaps.
- Pilot on a terminal and its plantRead the existing systems, add sub-meters where needed, and run through a full seasonal shift if possible.
- Judge on verified outcomesUnaccounted water, plant faults found early, energy against baseline and air in crowded zones, each measured.
Airport intelligence platform scorecard
| Criterion | Weight | What good looks like |
|---|---|---|
| Campus coverage | 15% | Terminals, plant and airside utilities in one hierarchy |
| Integration depth | 20% | Several BMS and SCADA read without replacement |
| Water balance | 15% | Campus water reconciled, unaccounted loss live |
| Energy and electrical visibility | 15% | Single line live, baselines normalized for weather and traffic |
| Air and comfort | 10% | Gate and hall air read against occupancy |
| Fault detection and CMMS | 15% | Plant faults found early and routed with a fix |
| Security and control | 10% | Read-only where required; where control is enabled, with owner approval, commands logged |
Integration and data at an airport
Airports rarely start from scratch. The platform should read every existing BMS over BACnet or Modbus, read plant and water SCADA read only, and take meter data from whatever network carries it. Wireless LoRaWAN sensors add coverage in washrooms, gate areas and plant rooms without disruptive cable runs in operational areas. Each device is mapped to its terminal, level, zone and asset.
Security reviews at airports are serious, so read-only integration with operational systems and clear data handling matter. Findings route to the CMMS. Where control is enabled, with owner approval, it is added system by system through field device controllers, with every command logged.
Compliance and reporting for airports
- Airport carbon programsScope 1 and 2 data traced to meters supports carbon accreditation and annual reporting.
- ISO 50001Energy baselines and performance indicators across terminals and plant.
- Water auditsA campus balance supports water loss audits in the style of AWWA M36.
- Indoor airContinuous gate and hall data shows ventilation performance against ASHRAE 62.1 in use.
Where Aqueduct fits
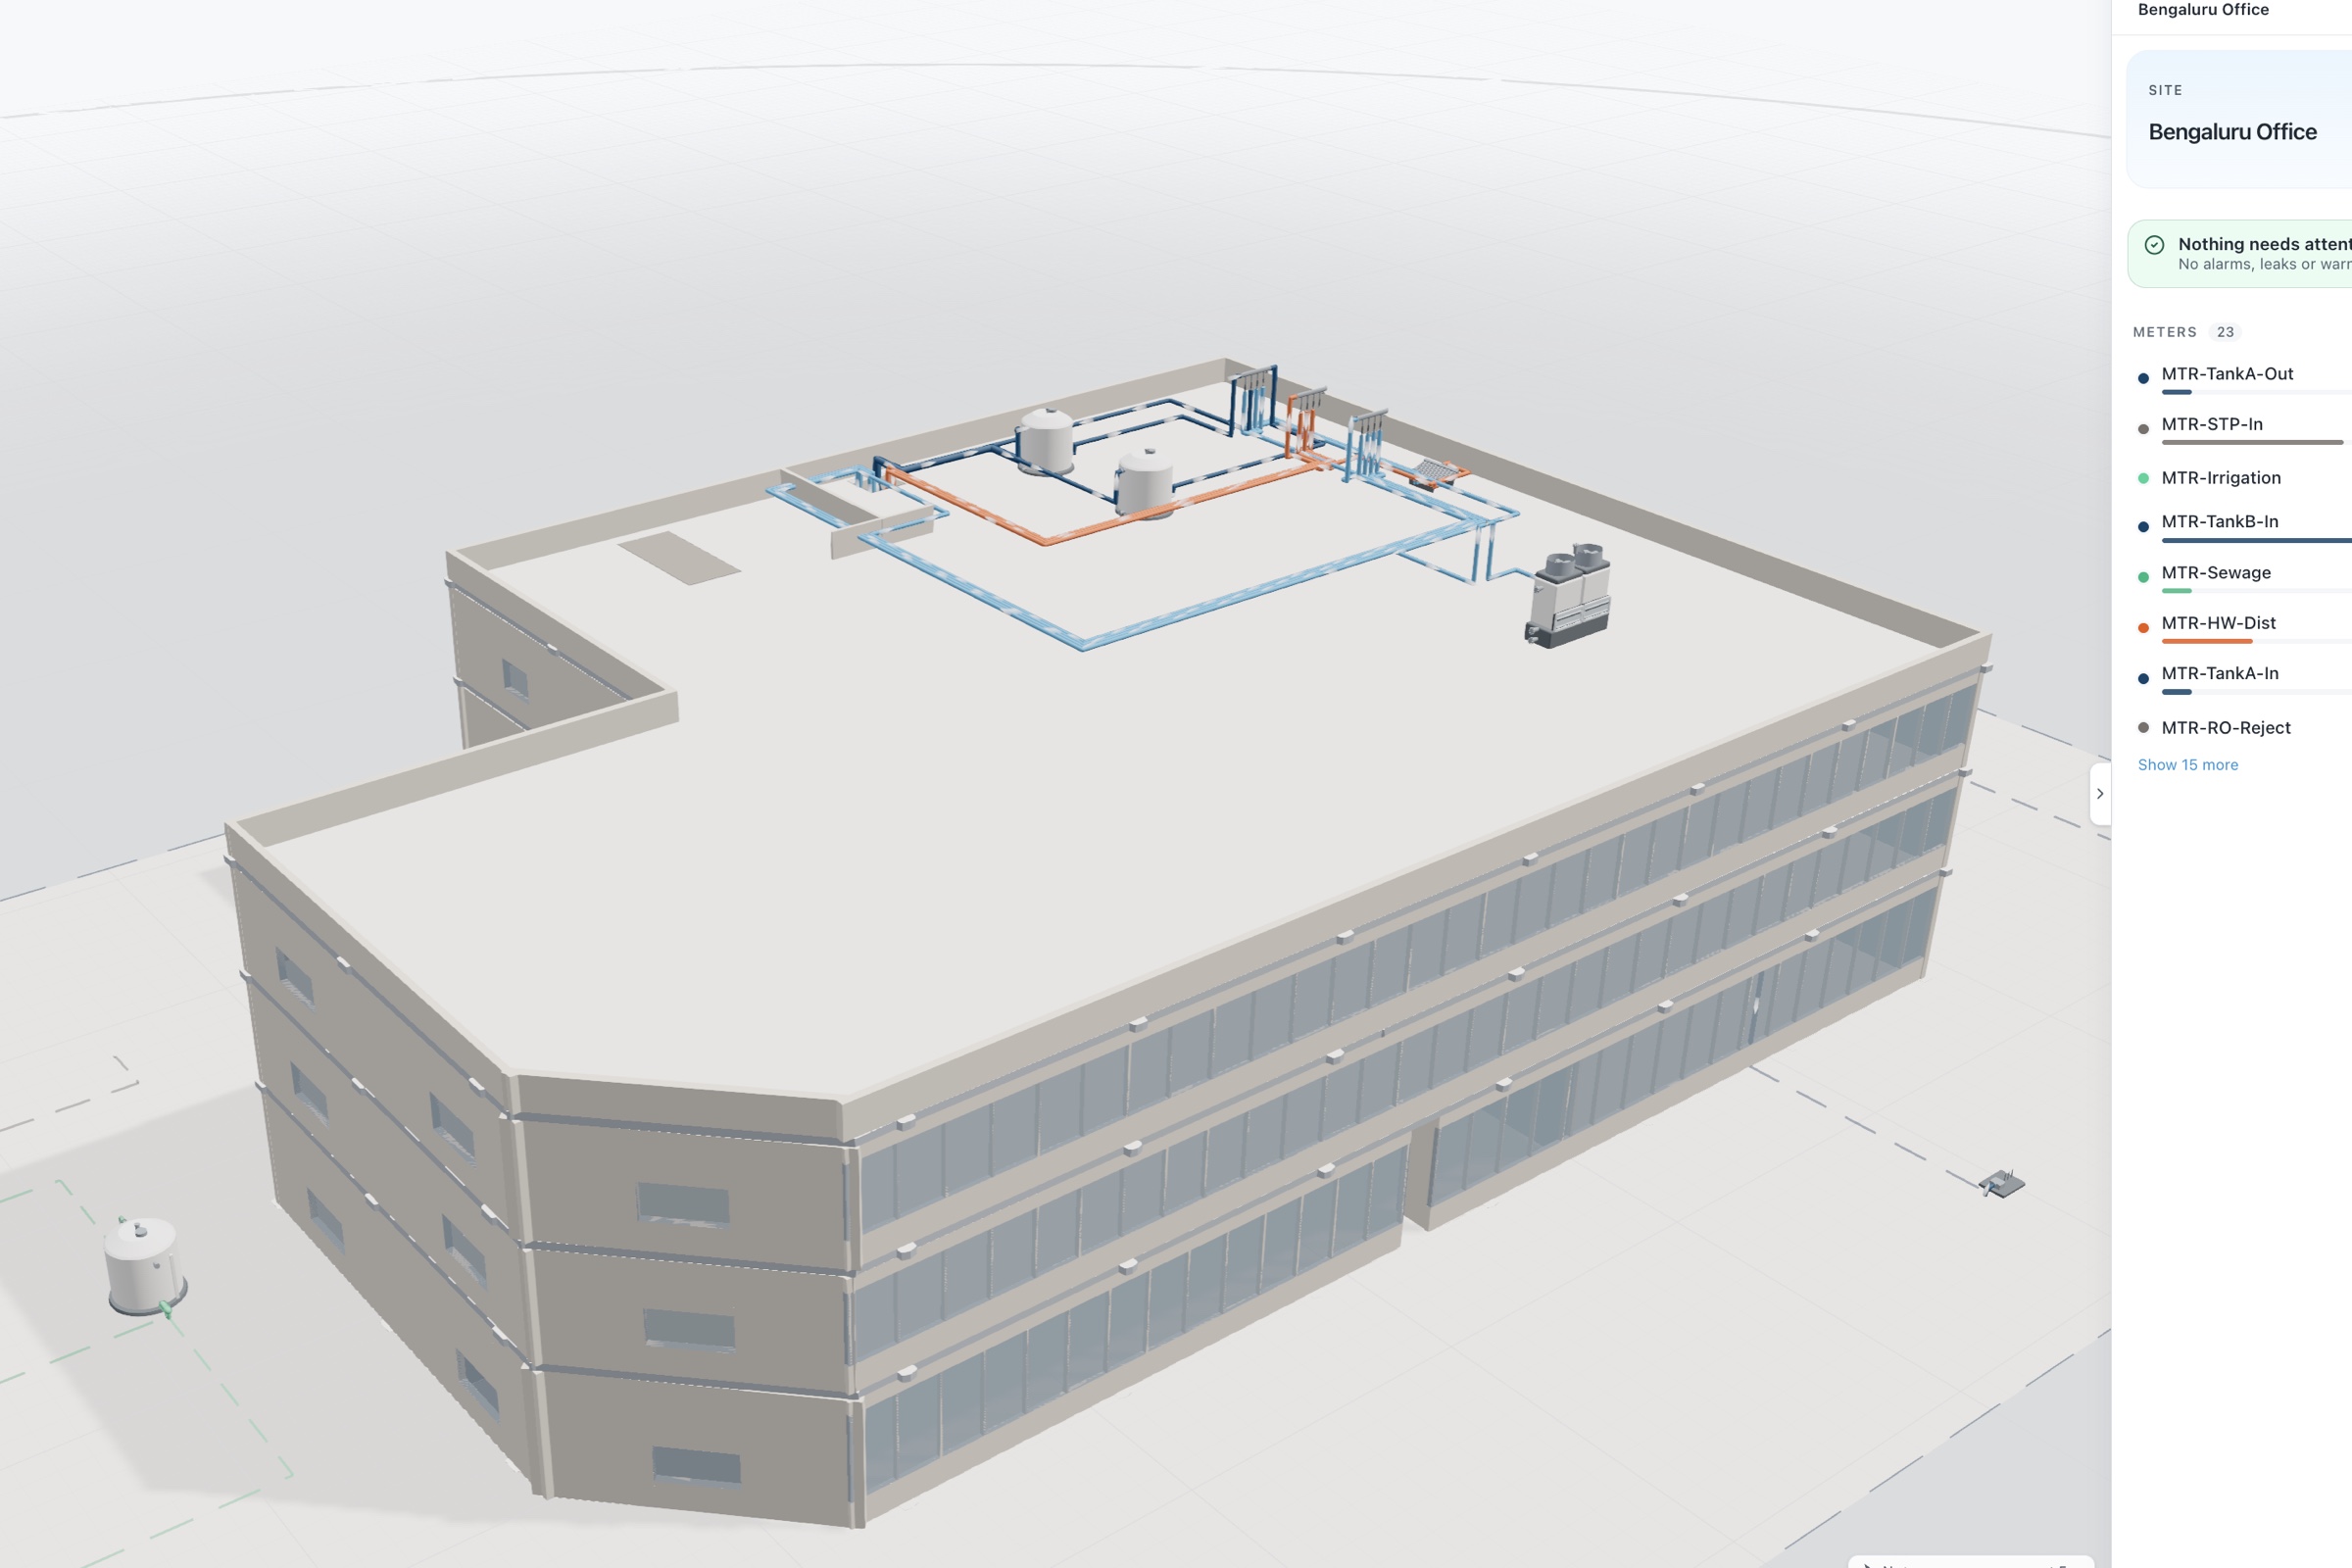
Aqueduct is a facility intelligence platform. aQ Core holds the whole airport campus as one hierarchy, from terminal to zone to device. aQ EnergySmart shows the electrical single line live, with grid, generation and feeders, and builds weather-normalized baselines from bills on day one. aQ WaterGuard reconciles campus water with unaccounted loss as a live number. aQ AirSafe reads gate and hall air against occupancy. aQ PredictIQ watches plant for vibration and energy drift. aQ Assistant answers questions about any terminal, zone or asset in plain language.
Aqueduct serves a top 25 US airport. Airports keep their BMS and SCADA and read from them, replace end-of-life systems, or build the layer into new terminals. Where control is enabled, with owner approval, Smart Controls can act on HVAC and ventilation through field device controllers, with lockout protection and a full command history.